On this page
- 01Key takeaways
- 02What makes a good cost reduction KPI?
- 03Which six KPIs should you track?
- 04How do the KPIs work together?
- 05How do you calculate cost per task after outsourcing?
- 06How should the KPIs be reported?
- 07What should you not measure?
- 08What does this look like in practice?
- 09Cost reduction KPI checklist
- 10Next step
- 11Sources and further reading
- 12Frequently asked questions
Key takeaways
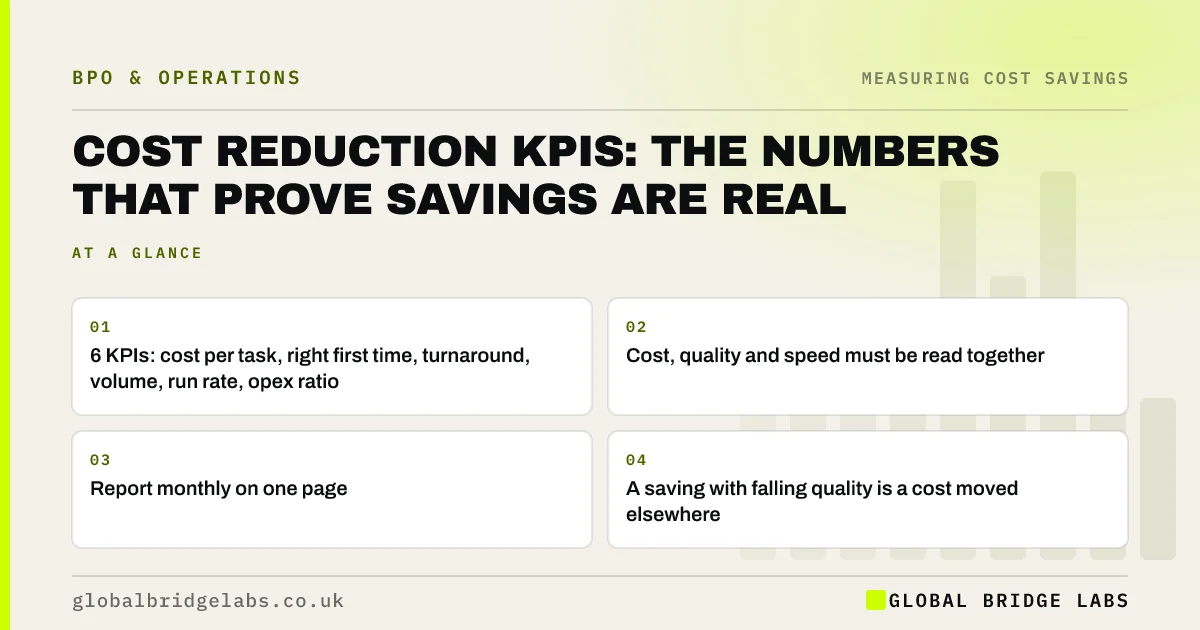
Cost reduction KPIs should show three things together: that unit cost fell, that quality held and that the saving is recurring. Six measures cover it: cost per task, right first time rate, turnaround time, volume, run-rate saving and the operating expense ratio. Reporting cost alone invites savings that are really cuts in service.
- 6 KPIs: cost per task, right first time, turnaround, volume, run rate, opex ratio.
- Cost, quality and speed must be read together.
- Report monthly on one page.
- A saving with falling quality is a cost moved elsewhere.
Want a one-page savings report set up? Message us on WhatsApp with the processes you have changed.
Chat on WhatsApp →What makes a good cost reduction KPI?
A good cost reduction KPI is a measure that changes only when the cost of doing the work really changes. It is calculated the same way every month, it can be traced to source data, and it cannot be improved by doing less work or worse work without that showing up elsewhere on the page.
Which six KPIs should you track?
Track two cost measures, two quality measures and two context measures. Together they make it very hard for a saving to be an illusion.
- Cost per task: total process cost divided by items completed.
- Right first time rate: share of items needing no correction.
- Turnaround time: average time from request to completion.
- Volume: items handled, to explain movements in total cost.
- Run-rate saving: the annualised recurring saving against baseline.
- Operating expense ratio: operating costs as a share of revenue.
How do the KPIs work together?
The KPIs work together by checking each other. In an illustrative month, cost per task falls from £3.46 to £2.10. Read alone, that is a 39% saving. But if right first time has dropped from 88% to 74%, the cost of corrections has moved to someone else's desk.
If instead right first time has risen to 95% and turnaround has shortened from 9 days to 2, the saving is real and the process is better. The cost figure was the same in both cases. Only the other measures told them apart.
Want your KPIs checked against each other? Send us the figures on WhatsApp.
Chat on WhatsApp →How do you calculate cost per task after outsourcing?
After outsourcing, cost per task is the provider's invoice plus your own review and management time plus any tools you pay for, divided by items completed. Leaving out in-house time is the most common way a saving is overstated. Use the same loaded hourly rates as the baseline.
- 1. Take the provider's invoice for the month.
- 2. Add in-house review hours at loaded rates.
- 3. Add software and other direct costs.
- 4. Divide by items completed.
- 5. Compare with the baseline cost per task.
How should the KPIs be reported?
Report them monthly on one page, with the baseline, the target and the latest three months side by side. Add one line of explanation for any figure that moved more than expected. If a provider runs the process, they should supply the volume, quality and turnaround data, and you should add the cost.
What should you not measure?
Do not measure activity for its own sake: hours logged, emails sent, calls made. These rise when people are busy, not when costs fall. Do not use headcount as a savings KPI either. It encourages cutting people while the work is pushed onto overtime or contractors.
What does this look like in practice?
A pattern we see in monthly reviews: the only number discussed is the provider's invoice against the old salary. It looks excellent. Nobody is counting the two hours a day a manager now spends checking the output. Adding that line does not end the saving, but it halves it, and it shows where the next improvement is.
Cost reduction KPI checklist
Confirm your reporting covers these.
- Each KPI has a written definition.
- The baseline uses the same definition.
- In-house time is included in cost.
- Quality and speed sit beside cost.
- Volume is shown for context.
- Savings are stated as a run rate.
- The report fits on one page.
Next step
Tell us which processes you have changed or plan to change. We will help you set up the six measures and a one-page report that shows whether the saving is real.
Message us on WhatsApp to set up your savings KPIs, or book a 30-minute consultation.
Chat on WhatsApp →Sources and further reading
- Labour productivity · Office for National Statistics
- UK Customer Satisfaction Index · Institute of Customer Service
Frequently asked questions
What KPIs measure cost reduction?
The most useful are cost per task, right first time rate, turnaround time, volume handled, run-rate saving and the operating expense ratio. Cost per task shows the unit saving. The others confirm that quality and speed held and that the saving recurs.
How do you prove a cost saving is real?
Compare cost per task against a baseline measured before the change, using the same definition. Include in-house review time in the new cost. Confirm that error rates and turnaround have not worsened. State the result as an annual recurring figure, separate from one-off gains.
Why is total cost a poor KPI?
Total cost moves with volume. It can fall because fewer orders arrived, or rise because the business grew, with no change in efficiency. Cost per task removes that effect and shows whether each unit of work became cheaper to deliver.
How many KPIs should a small business track?
Five or six per changed process is enough, and they should fit on one page. More than that, and the report is skimmed. The important thing is that cost, quality and speed appear together so no single figure can mislead.
Written by

Global Bridge Labs (GBL) is a UK–Sri Lanka partner for social media, websites and BPO. Everything here comes from client delivery, not theory.