On this page
- 01Key takeaways
- 02What is cost benchmarking?
- 03Why are industry averages unreliable?
- 04What can you benchmark against?
- 05What does a worked benchmark look like?
- 06Where can you find UK wage and cost data?
- 07How do you keep comparisons fair?
- 08What does this look like in practice?
- 09Cost benchmarking checklist
- 10Next step
- 11Sources and further reading
- 12Frequently asked questions
Key takeaways
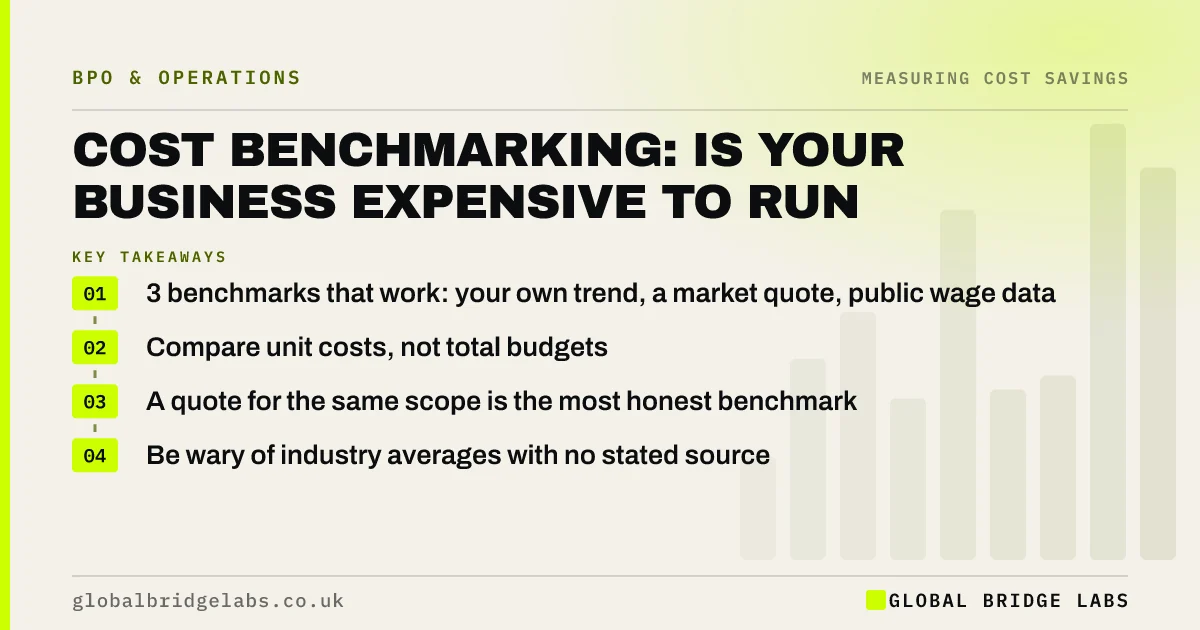
Cost benchmarking for a small business means comparing your costs with a reference point to see whether you are expensive to run. Reliable external data for small firms is scarce, so the most useful benchmarks are your own history, a real market quote and public wage data. Compare unit costs, such as cost per order, not totals.
- 3 benchmarks that work: your own trend, a market quote, public wage data.
- Compare unit costs, not total budgets.
- A quote for the same scope is the most honest benchmark.
- Be wary of industry averages with no stated source.
Want a market comparison for one of your processes? Message us on WhatsApp with the scope.
Chat on WhatsApp →What is cost benchmarking?
Cost benchmarking is the practice of comparing the cost of an activity with a standard, such as past performance, another business or a market price, to judge whether it is higher than it should be. It turns a figure into a judgement. £3.46 per invoice means nothing until it is set beside something.
Why are industry averages unreliable?
Industry averages are unreliable for small businesses because they are often drawn from large companies, from surveys with few respondents, or from sources that cannot be traced. Definitions differ too. One firm's operating cost includes directors' pay and another's does not. An average you cannot trace is an anecdote with a decimal point.
What can you benchmark against?
Benchmark against three things you can verify. Your own history shows direction. A market quote shows what the same work costs if bought. Public wage data shows whether you are paying a sensible rate for the role.
- Your own trend: cost per task over the last three years.
- A market quote: a provider's price for the same written scope.
- Public wage data: ONS earnings figures by occupation and region.
What does a worked benchmark look like?
Take an illustrative firm whose order admin costs £4.10 per order. Three years ago it was £3.20, so cost per order has risen 28% while volume grew. A provider quotes the same scope at a price equal to £2.60 per order. The role doing the work is paid in line with the ONS figure for that occupation.
The conclusion is specific. Pay is not the issue. The process has become less efficient as it grew, and the market can do it for about 37% less. That is a far more useful finding than being above or below an industry average.
- Own trend: £3.20 to £4.10 per order, up 28%.
- Market quote: £2.60 per order, about 37% lower.
- Wage check: in line with published earnings data.
- Work out your cost per task before you outsource
- The cost lever scorecard: find savings process by process
Want this three-way benchmark run on your numbers? Send them on WhatsApp and we will discuss your requirements.
Chat on WhatsApp →Where can you find UK wage and cost data?
The Office for National Statistics publishes the Annual Survey of Hours and Earnings, which gives pay by occupation, and Table 14 breaks it down by detailed job type. GOV.UK publishes National Minimum Wage rates and employer National Insurance thresholds. For outsourced work, indicative market ranges are £9–£18 per hour offshore and £20–£35 onshore.
How do you keep comparisons fair?
Keep comparisons fair by matching scope, quality and what is included. A quote that excludes supervision is not comparable with an in-house cost that includes it. A cheaper process with twice the error rate is not cheaper. Write down the scope before you compare anything.
- Same tasks and volumes.
- Same hours of cover.
- Same quality standard.
- Same inclusions: supervision, tools, holiday cover.
What does this look like in practice?
A pattern we see when owners look for benchmarks: they search for an industry figure, find three that disagree, and give up. Getting one written quote for a clearly described process settles the question in a week, and it is a number someone is prepared to stand behind.
Cost benchmarking checklist
Use these steps for each process you benchmark.
- Calculate current cost per task.
- Calculate it for the last two or three years.
- Write a one-page scope.
- Get one or two quotes against that scope.
- Check pay against ONS data for the role.
- Compare like for like on quality and inclusions.
Next step
Send us a short description of one process and its monthly volume. We will tell you what the market range looks like for that scope, so you have a benchmark you can trust.
Message us on WhatsApp for a market comparison, or book a 30-minute consultation.
Chat on WhatsApp →Sources and further reading
- Employee earnings in the UK (Annual Survey of Hours and Earnings) · Office for National Statistics
- Earnings and hours worked, occupation by four-digit SOC: ASHE Table 14 · Office for National Statistics
- National Minimum Wage and National Living Wage rates · GOV.UK
Frequently asked questions
How do you benchmark business costs?
Calculate your cost per unit for a specific activity, then compare it with your own past figures, a market quote for the same scope and published wage data for the role. Make sure the comparison covers the same tasks, quality and inclusions.
What is the best benchmark for a small business?
Your own trend is the most reliable, because the definitions are consistent. A written quote from a provider for the same scope is the best external benchmark, since it is a real price. Industry averages are the weakest unless the source and method are clear.
Where can I find UK salary benchmarks?
The Office for National Statistics publishes the Annual Survey of Hours and Earnings, which reports earnings by occupation, region and industry. Table 14 gives detailed occupation data. It is free and is the standard public reference for UK pay.
How often should costs be benchmarked?
Once a year for your main processes is enough. Track your own unit costs monthly, and test the market with a quote when a cost has risen noticeably or a contract is due for renewal.
Written by

Global Bridge Labs (GBL) is a UK–Sri Lanka partner for social media, websites and BPO. Everything here comes from client delivery, not theory.