On this page
- 01Key takeaways
- 02Which website speed statistics are reliable?
- 03What do single-company case studies show?
- 04What do the human limits research say?
- 05Which popular statistics should you stop quoting?
- 06How should a small business use these numbers?
- 07What does this look like in practice?
- 08Speed statistics checklist
- 09Next step
- 10Sources and further reading
- 11Frequently asked questions
Key takeaways
The website speed statistics worth quoting are the ones with a named source, a date and a method. That list is shorter than most articles suggest. It includes Deloitte's 2020 study for Google, the BBC's finding on lost users and a set of single-company case studies published by Google's web.dev. Several famous figures are a decade old or impossible to trace, and should be retired.
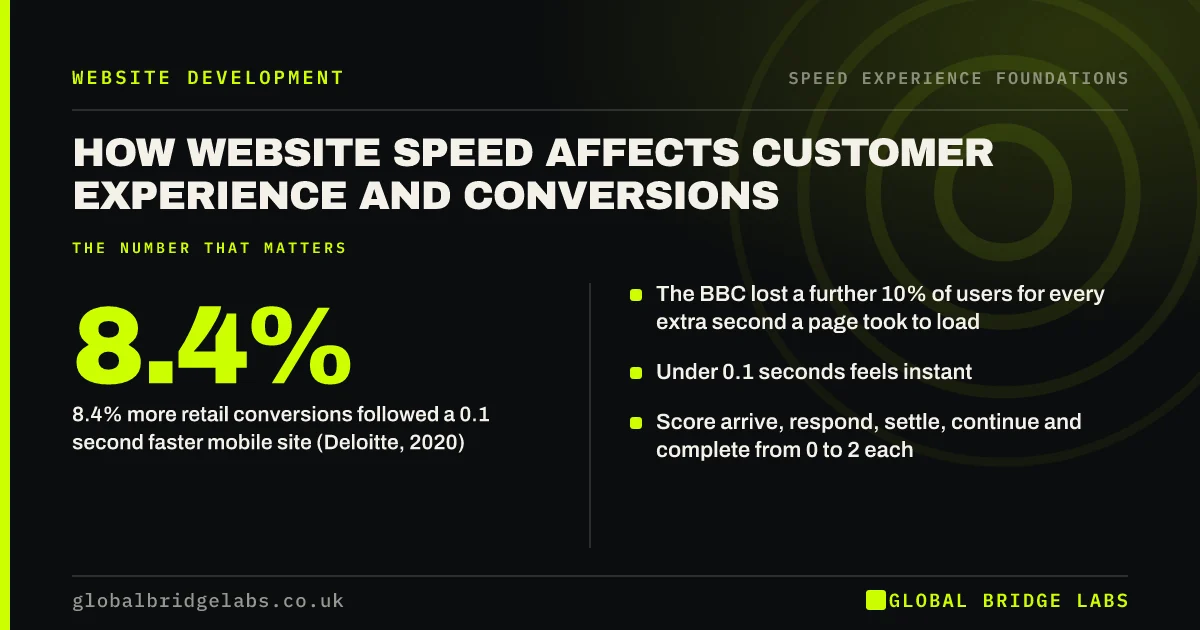
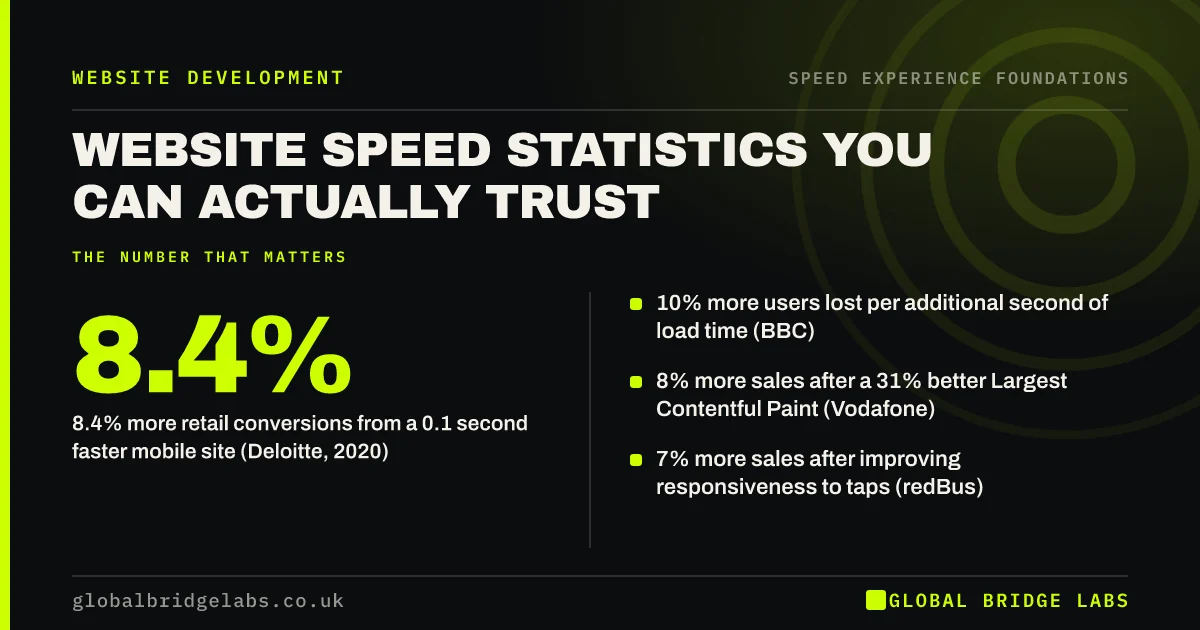
- 8.4% more retail conversions from a 0.1 second faster mobile site (Deloitte, 2020).
- 10% more users lost per additional second of load time (BBC).
- 8% more sales after a 31% better Largest Contentful Paint (Vodafone).
- 7% more sales after improving responsiveness to taps (redBus).
- The '53% leave after three seconds' figure dates from 2016. Quote it with its age.
Need figures for a board paper on your own site? Message us on WhatsApp.
Chat on WhatsApp →Which website speed statistics are reliable?
Reliable speed statistics come from studies that say who was measured, when and how. The strongest multi-company source is Deloitte's Milliseconds Make Millions, commissioned by Google and published in 2020, which analysed mobile sessions across brands in Europe and the United States.
- Retail: a 0.1 second improvement was associated with 8.4% more conversions and 9.2% higher order value.
- Travel: 10.1% more conversions for the same improvement.
- Luxury: 8.6% more page views per session.
- Lead generation: an 8.3% better bounce rate on information pages.
What do single-company case studies show?
Google's web.dev publishes case studies in which one company changed its speed and reported the result. They are not averages and should not be read as forecasts, but each names the metric that moved.
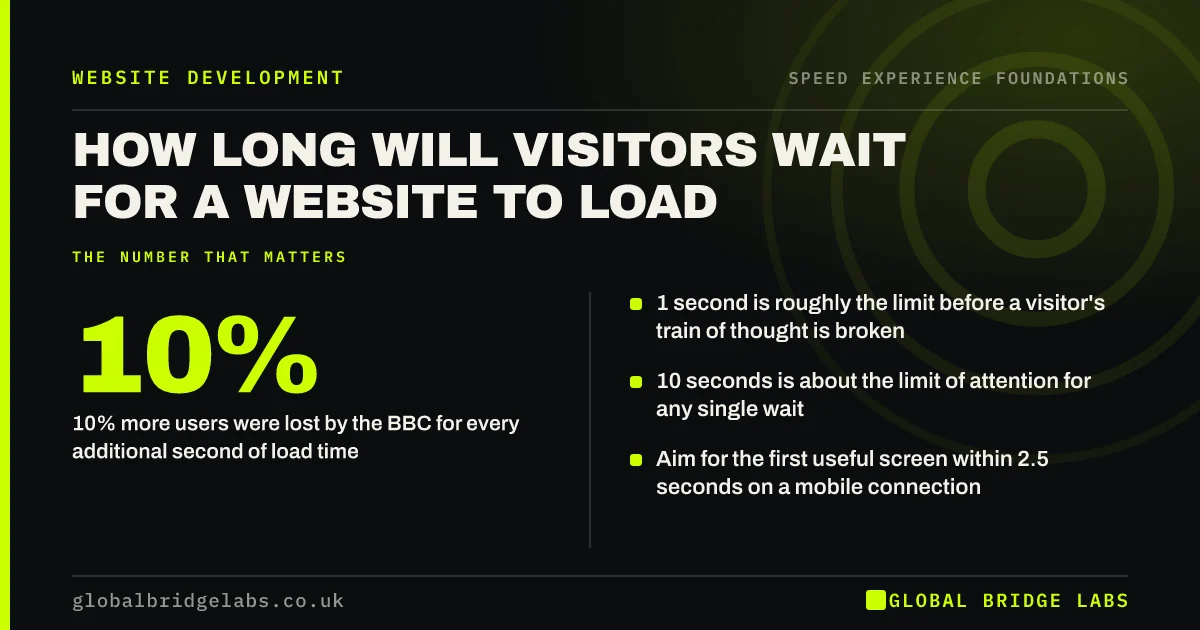
- BBC: an additional 10% of users lost for every extra second of load time.
- Vodafone: a 31% improvement in LCP produced 8% more sales in a controlled test.
- redBus: improving Interaction to Next Paint increased sales by about 7%.
- Rakuten 24: investment in Core Web Vitals raised revenue per visitor by 53%.
- The Economic Times: passing Core Web Vitals brought a 43% better bounce rate.
- Yahoo! Japan: fixing layout shift lifted page views per session by 15%.
What do the human limits research say?
The oldest reliable figures are about people, not websites. The Nielsen Norman Group's response time limits state that 0.1 seconds feels instant, 1 second keeps a person's train of thought, and 10 seconds is about the limit of attention. They are based on research going back to 1968 and have not changed with technology.
Google's own targets build on them: main content within 2.5 seconds, interactions answered within 200 milliseconds and a server response within about 0.8 seconds. Chrome's usage data also shows that one in ten desktop navigations and one in five on mobile are back or forward moves, which is why the speed of returning to a page matters.
Which popular statistics should you stop quoting?
Three figures appear in almost every article on speed and deserve caution. They are not necessarily wrong. They are old, and the original sources are hard or impossible to check.
- '53% of mobile visits are abandoned after three seconds': Google research from 2016, no longer hosted at its original address.
- 'Every 100 milliseconds costs 1% of sales': an Amazon experiment reported in 2006.
- '47% of people expect a page to load in two seconds': a survey from 2009.
Want to know what speed is worth on your site, not Amazon's? Ask us on WhatsApp.
Chat on WhatsApp →How should a small business use these numbers?
Use published statistics to decide whether speed is worth investigating, and your own data to decide what to do. A retail conversion uplift measured across large brands tells you the effect is real. It does not tell you what a plumber in Leeds will gain from a faster service page.
Your own evidence is simple to collect: field data for your landing pages, the share of very short mobile sessions, and enquiries before and after a change. Three months of your figures beat any benchmark.
What does this look like in practice?
A pattern we see in proposals and pitch decks: a slide claims that a one-second delay costs 7% of conversions, with no source, and the budget is built on it. When the project finishes, nobody can say whether it worked, because nothing was measured beforehand.
Recording a baseline for load, enquiries and bounce on the key pages before any work starts makes the result provable either way. Global Bridge Labs (GBL) sets that baseline first.
Speed statistics checklist
- Quote a figure only with its source and year.
- Prefer controlled tests and multi-company studies.
- Label single-company results as case studies.
- Retire figures older than ten years or without a traceable source.
- Record your own baseline before any speed work.
Next step
Borrowed statistics start the conversation. Your own numbers finish it. We can set up the baseline so the next speed decision is made on evidence from your site.
Message us on WhatsApp to get a speed and enquiry baseline for your key pages.
Chat on WhatsApp →Sources and further reading
- Milliseconds make millions: mobile site speed and conversion · Deloitte
- The business impact of Core Web Vitals · web.dev (Google)
- Why does speed matter? · web.dev
- How redBus improved Interaction to Next Paint and increased sales by 7% · web.dev (Google)
- Response times: the 3 important limits · Nielsen Norman Group
- Back/forward cache · web.dev (Google)
Frequently asked questions
What is the most reliable website speed statistic?
Deloitte's 2020 Milliseconds Make Millions study is the strongest multi-company source. It found that a 0.1 second improvement in mobile site speed was associated with 8.4% more retail conversions and 10.1% more travel conversions. It names its method and covers many brands.
Is it true that 53% of visitors leave after three seconds?
The figure comes from Google research published in 2016, on the phones and networks of that time, and the original page is no longer available. The direction is still right, but quote it as a dated figure. More recent, traceable evidence exists from Deloitte and web.dev.
How much does a one-second delay cost?
There is no universal figure. The BBC found it lost an additional 10% of users for each extra second of load time. Other sites report different effects. The honest answer for your business comes from your own traffic, conversion rate and order value.
Do speed statistics from big brands apply to small businesses?
The direction applies. The size of the effect does not transfer. Large sites can measure a change of a few percent because they have millions of visits. A small business should use the studies as a reason to test its own pages, then rely on its own before-and-after figures.
Written by

Global Bridge Labs (GBL) is a UK–Sri Lanka partner for social media, websites and BPO. Everything here comes from client delivery, not theory.