On this page
- 01Key takeaways
- 02Why do most speed reports go unread?
- 03Which five numbers belong in the report?
- 04How do you turn speed into money?
- 05What should the page look like?
- 06How often should you report?
- 07What does this look like in practice?
- 08Speed report checklist
- 09Next step
- 10Sources and further reading
- 11Frequently asked questions
Key takeaways
A website speed report for directors should fit on one page and answer four questions: are customers waiting, what is it costing, what changed, and what decision is needed. Most speed reports fail because they are technical printouts with a score at the top. Report five numbers from real visitors, tie them to enquiries and end with a recommendation someone can approve or decline.
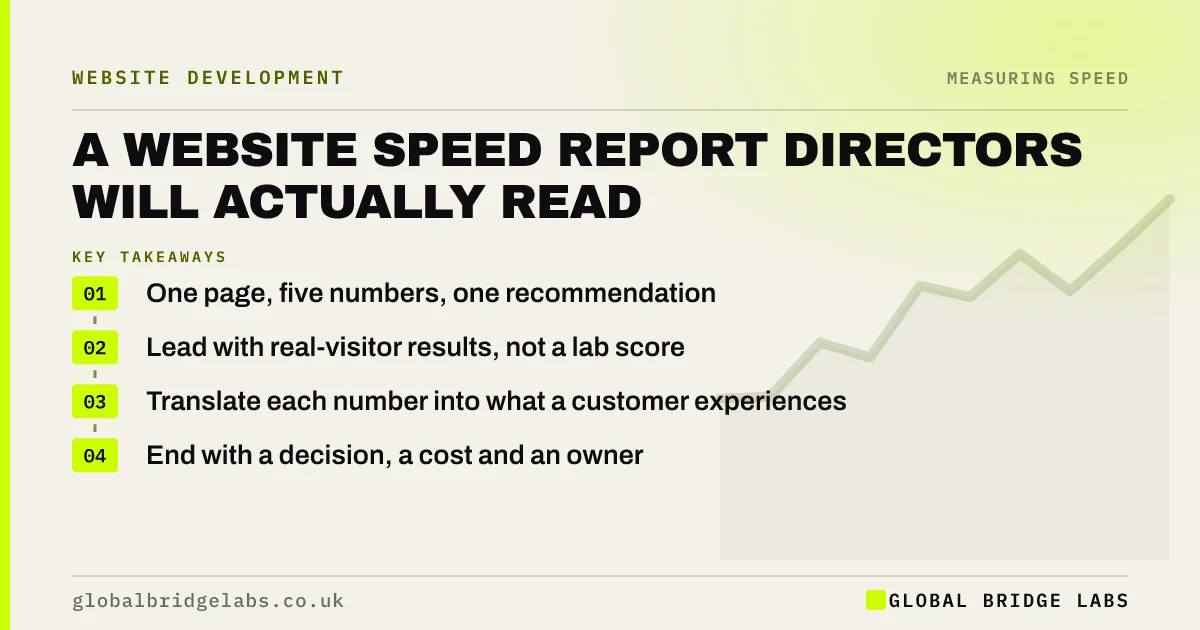
- One page, five numbers, one recommendation.
- Lead with real-visitor results, not a lab score.
- Translate each number into what a customer experiences.
- End with a decision, a cost and an owner.
Want a one-page speed report for your next board meeting? Message us on WhatsApp.
Chat on WhatsApp →Why do most speed reports go unread?
Most speed reports go unread because they describe the website and not the business. A list of acronyms, a coloured score and thirty technical recommendations give a director nothing to decide. The reader cannot tell whether 2.9 seconds is a problem, what it costs or what would fix it.
A useful report starts from the reader's question, which is rarely 'what is our Largest Contentful Paint?' and usually 'are we losing customers, and should we spend money on it?'
Which five numbers belong in the report?
Five numbers cover it. Each has a plain-English meaning to state beside it.
- Share of mobile pages passing Core Web Vitals: are real visitors getting a good experience?
- Main content time on the top landing page: how long before a customer sees the offer?
- Response to taps: do buttons react when pressed?
- Enquiry form confirmation time: how long after Send?
- Mobile against desktop enquiry rate on the same pages: is the gap widening?
How do you turn speed into money?
Attach a simple, labelled estimate. Take monthly mobile visits to the slow pages, an assumed share lost to waiting, your enquiry rate and your average job value. State the assumptions openly so the figure can be challenged.
An illustrative line might read: 'Our two slowest service pages receive 1,400 mobile visits a month. If one in ten leaves during the wait, at our 2% enquiry rate and £900 average job, that is roughly three lost enquiries and £700 of work a month.' A director can weigh that against a quote.
Want the cost estimate built on your own figures? Ask us on WhatsApp.
Chat on WhatsApp →What should the page look like?
Keep to a fixed layout so that each month's report can be compared with the last.
- 1. Headline: one sentence on whether customers are waiting.
- 2. Five numbers, each with last period's value and a status colour.
- 3. What changed on the site since the last report.
- 4. Estimated cost of the current position.
- 5. Recommendation, with cost, owner and date.
- 6. Method note: tool, pages and device, in one line.
How often should you report?
Quarterly is enough for most small businesses, with a short note after any significant site change. Monthly suits online shops and sites under active development. Field data moves over 28 days, so reporting more often than monthly shows noise.
When nothing has changed and everything passes, say so in two lines. A report that always demands action teaches people to ignore it.
What does this look like in practice?
A pattern we see in management packs: a twelve-page automated speed report is attached every month and never discussed. When it is replaced with one page showing that the top landing page takes five seconds on mobile and what that probably costs, the fix is approved at the next meeting.
The data did not change. The presentation did. Global Bridge Labs (GBL) reports speed in business terms for that reason.
Speed report checklist
- Limit the report to one page.
- Use real-visitor data for the headline numbers.
- Explain each number in a sentence.
- Show the previous period beside the current one.
- Include a labelled cost estimate.
- Close with one recommendation, a cost and an owner.
Next step
If your speed reports are not leading to decisions, they are the wrong reports. We can produce a one-page version for your site that a board can act on.
Message us on WhatsApp for a one-page website speed report.
Chat on WhatsApp →Sources and further reading
- Core Web Vitals report · Search Console Help
- About PageSpeed Insights · Google for Developers
- About key events · Google Analytics Help
- Understanding Core Web Vitals and Google search results · Google Search Central
Frequently asked questions
What should a website speed report include?
Five real-visitor numbers with plain explanations, a comparison with the previous period, a note of what changed on the site, an estimated cost of any slowness and one recommendation with a cost and an owner. It should fit on one page.
How do I explain website speed to directors?
Describe what a customer experiences and what it costs. Say how long a phone visitor waits to see the offer, whether buttons respond, and how many enquiries the delay is likely losing. Avoid acronyms unless you explain them in the same sentence.
How often should website speed be reported?
Quarterly for most small businesses, monthly for online shops or sites being actively developed, and after any major change. Real-visitor data covers a rolling 28 days, so more frequent reporting mostly shows normal variation.
Should a speed report include the PageSpeed score?
It can, as a secondary figure. Lead with whether real visitors pass Core Web Vitals, because that reflects actual experience and is what Google uses. The lab score varies between runs and is easily misread as the goal.
Written by

Global Bridge Labs (GBL) is a UK–Sri Lanka partner for social media, websites and BPO. Everything here comes from client delivery, not theory.