On this page
- 01Key takeaways
- 02What is a website conversion rate?
- 03Why are published benchmarks misleading?
- 04What are realistic ranges by site type?
- 05How do you calculate your conversion rate properly?
- 06What moves conversion rate most?
- 07When is a higher conversion rate not better?
- 08What does this look like in practice?
- 09Benchmarking checklist
- 10Next step
- 11Sources and further reading
- 12Frequently asked questions
Key takeaways
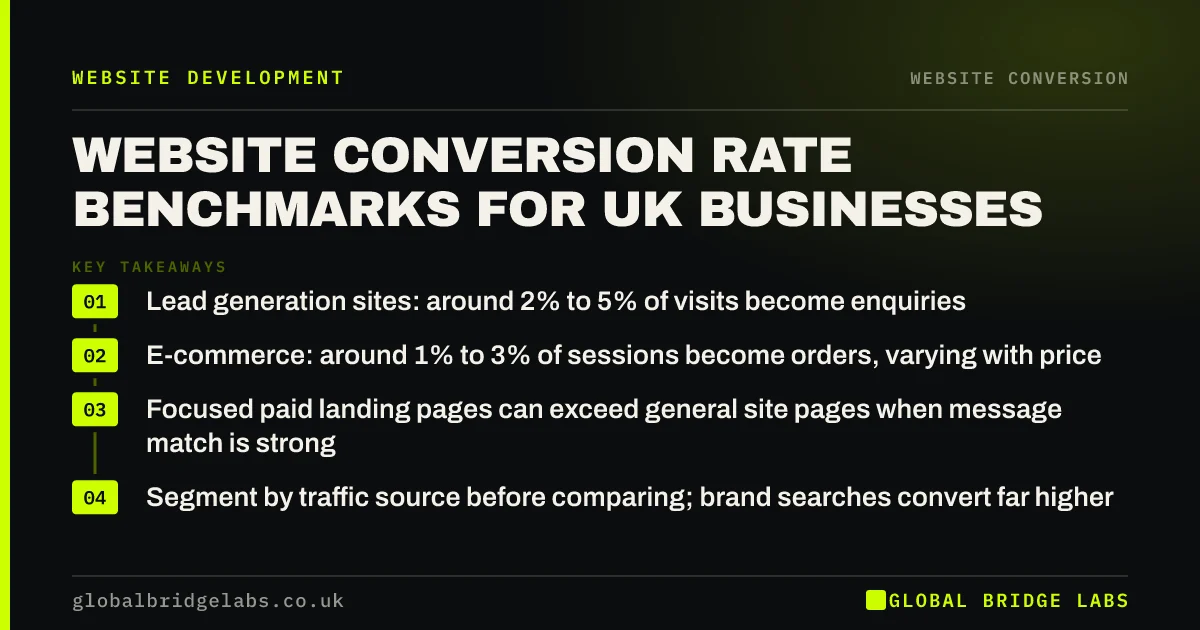
Website conversion rate benchmarks for UK businesses vary widely by site type, traffic source and offer, so treat any published average as orientation only. As working ranges, lead generation sites convert around 2% to 5% of visits into enquiries, and e-commerce sites around 1% to 3% of sessions into orders.
- Lead generation sites: around 2% to 5% of visits become enquiries.
- E-commerce: around 1% to 3% of sessions become orders, varying with price.
- Focused paid landing pages can exceed general site pages when message match is strong.
- Segment by traffic source before comparing; brand searches convert far higher.
- Your previous quarter is a better benchmark than any industry average.
Want your conversion rate calculated properly and compared with your own trend? Message us on WhatsApp.
Chat on WhatsApp →What is a website conversion rate?
A website conversion rate is the percentage of visits, sessions or users that complete a defined valuable action, such as an enquiry, booking or purchase, within a given period.
The definition you choose changes the number. Enquiries per session, per user and per landing page visit all give different answers. Choose one definition, write it down and never change it mid-year, or the trend becomes meaningless.
Why are published benchmarks misleading?
Published benchmarks average across businesses with completely different prices, audiences and traffic mixes. A £20 impulse purchase and a £20,000 extension will never convert at similar rates, and a site whose visitors mostly search its brand name will convert far better than one relying on broad blog traffic.
Most benchmark reports also come from software vendors whose client base may not resemble a UK SME. They are useful to spot a figure that is wildly off, not to set targets.
- Different definitions of a conversion.
- Different traffic mixes: brand, organic, paid, social, referral.
- Different price points and buying cycles.
- Different tracking quality, especially for phone calls.
What are realistic ranges by site type?
Use these as working ranges for UK SMEs, not guarantees. They assume enquiries include forms, calls and chats, and that tracking is working.
- Local service business (trades, clinics): 3% to 8% of visits, higher for urgent services.
- Professional services and B2B: 1% to 4%, with higher value per enquiry.
- Paid search landing pages with strong message match: often above the site average.
- E-commerce, low price items: 2% to 4% of sessions.
- E-commerce, higher price items: 0.5% to 2% of sessions.
How do you calculate your conversion rate properly?
Record every enquiry route as a key event in Google Analytics 4: form submissions, phone clicks, WhatsApp clicks and completed bookings. Then divide key events by sessions for the same period. For e-commerce, use purchases divided by sessions.
Segment before you compare. Look separately at organic search, paid search, social, referral and direct traffic, and at mobile and desktop. A drop in the overall rate often turns out to be a change in traffic mix rather than a problem with the site.
Send us three months of sessions and enquiries on WhatsApp and we will segment them for you.
Chat on WhatsApp →What moves conversion rate most?
The biggest improvements usually come from clarity and trust rather than button colours: a clear headline, proof next to the call to action, pricing guidance, one primary action and a short form. Speed matters too, especially on mobile.
Across our client work, we have seen a 2.4x enquiry rate after a website rebuild, and those were the levers behind it. Conversion rate optimisation techniques such as A/B testing come later, once the fundamentals are in place and traffic is high enough to test.
When is a higher conversion rate not better?
A higher conversion rate is not better if the enquiries are worse. Removing all pricing information or offering a free quote to anyone may lift enquiries while lowering the share worth quoting, which costs time.
Track qualified enquiries alongside the raw rate. The number that matters is qualified enquiries per month and cost per qualified enquiry.
What does this look like in practice?
A pattern we see after new tracking goes in: the conversion rate appears to double overnight. Nothing about the site changed. The business simply started counting phone clicks and WhatsApp chats, which had been happening all along.
That is why tracking comes first. Benchmarks and targets mean nothing until the measurement captures every enquiry route consistently.
Benchmarking checklist
Do this before you set a conversion rate target.
- Write down one definition of a conversion.
- Track forms, calls, WhatsApp and bookings as key events.
- Collect at least three months of data.
- Segment by channel and device.
- Compare with your own previous quarter.
- Track qualified enquiries alongside the raw rate.
Next step
If you want to know whether your conversion rate is genuinely low or just badly measured, we will review your tracking and numbers with you in 30 minutes.
Message us on WhatsApp for a conversion rate review, or book a 30-minute consultation.
Chat on WhatsApp →Sources and further reading
- About key events · Google Analytics Help
- URL builders: collect campaign data with custom URLs · Google Analytics Help
- Understanding Core Web Vitals and Google search results · Google Search Central
Frequently asked questions
What is a good website conversion rate in the UK?
For UK lead generation sites, 2% to 5% of visits becoming enquiries is a reasonable working range, with urgent local services often higher. E-commerce sites typically convert 1% to 3% of sessions. Your own trend over time is a more useful benchmark than any average.
How do I calculate my website conversion rate?
Divide the number of conversions, such as enquiries or purchases, by the number of sessions in the same period, then multiply by 100. Make sure every enquiry route is tracked, including phone clicks and WhatsApp chats, and use the same definition every month so the trend stays meaningful.
Why is my conversion rate so low?
Common causes are traffic that does not match your buyers, an unclear offer, missing proof, a slow mobile experience, a complicated form, or enquiry routes that are not tracked. Segment by channel and device first, because a low overall rate is often caused by one weak traffic source.
Does a higher conversion rate always mean more sales?
No. A higher rate can come with lower-quality enquiries, for example after removing pricing information from service pages. Track qualified enquiries and cost per qualified enquiry alongside the headline rate, so improvements reflect real business rather than more conversations that go nowhere.
Written by

Global Bridge Labs (GBL) is a UK–Sri Lanka partner for social media, websites and BPO. Everything here comes from client delivery, not theory.