On this page
- 01Key takeaways
- 02What is a website speed scorecard?
- 03How do you score each of the five areas?
- 04How do you check the score against real data?
- 05What does your total mean?
- 06What are the limits of the scorecard?
- 07What does this look like in practice?
- 08Speed scorecard checklist
- 09Next step
- 10Sources and further reading
- 11Frequently asked questions
Key takeaways
The GBL Speed Experience Scorecard rates a website on five things a customer can feel: Arrive, Respond, Settle, Continue and Complete. Each is scored 0, 1 or 2 on a real phone over mobile data, giving a total out of 10. It takes about an hour, needs no technical knowledge and tells you which part of the journey to fix first.
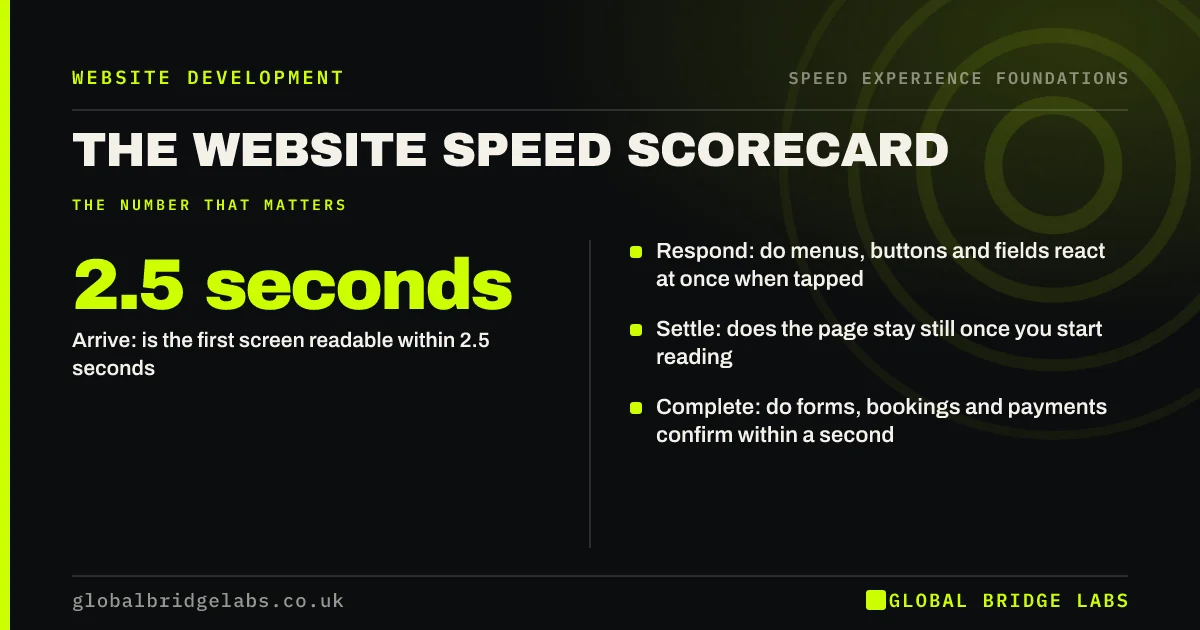
- Arrive: is the first screen readable within 2.5 seconds?
- Respond: do menus, buttons and fields react at once when tapped?
- Settle: does the page stay still once you start reading?
- Complete: do forms, bookings and payments confirm within a second?
- 8 to 10 is fast where it counts. 4 or below is costing you customers.
Prefer us to score it? Send the URL on WhatsApp and we will return the scorecard with notes.
Chat on WhatsApp →What is a website speed scorecard?
A website speed scorecard is a short, repeatable test that rates how fast a site feels at each stage of a customer's visit, instead of reducing speed to a single technical score.
Automated tools tell you what a simulated phone recorded on one page. They do not submit your enquiry form, open your menu or try your booking widget. The scorecard covers the whole journey from search result to sent enquiry, which is where customers experience your speed and where most sites have never been tested.
How do you score each of the five areas?
Score each area on your three most important landing pages, then take the lowest result. Use a mid-range phone, switch off Wi-Fi and clear the browser's stored data first, so you see what a first-time visitor sees.
- Arrive: 2 if the headline and main button appear within about 2.5 seconds, 1 if within 4, 0 if longer.
- Respond: 2 if every tap reacts at once, 1 if some lag, 0 if taps are ignored or need repeating.
- Settle: 2 if nothing moves after it appears, 1 if one shift, 0 if you mis-tap because of a jump.
- Continue: 2 if the next two pages are as quick as the first, 1 if slower, 0 if each feels like a fresh wait.
- Complete: 2 if the form or booking confirms within a second or shows progress, 1 if it pauses, 0 if you doubt it worked.
How do you check the score against real data?
Back up what you felt with field data. Enter each page into PageSpeed Insights and look at the mobile tab. Where it shows real-user data, it reports Largest Contentful Paint (LCP), Interaction to Next Paint (INP) and Cumulative Layout Shift (CLS) over the previous 28 days at the 75th percentile, meaning the experience of your slower visitors.
Arrive maps to LCP, Respond to INP and Settle to CLS. If a page scores 2 by hand but fails in field data, your phone or signal was better than your customers'. If the tool says pass and the page felt slow, trust what you felt and look at Continue and Complete, which the tool does not measure.
Want the field data for your site explained in plain English? Ask us on WhatsApp.
Chat on WhatsApp →What does your total mean?
The total tells you how urgent the work is. The lowest single area tells you where to start.
- 8 to 10: fast where it counts. Protect it with a quarterly re-score.
- 5 to 7: quick in places but leaking enquiries. Fix the lowest area first.
- 4 or below: slow enough to cost customers every week. Start with Arrive.
What are the limits of the scorecard?
The scorecard is a judgement on one phone on one day. It will not tell you the cause of a problem or give a precise measure, and two people may score a borderline page differently. It also rates speed only. A site can score 10 and still fail to win enquiries because the offer is unclear.
Use it to decide where to look, then use tools to find out why. For the wider question of whether a quick site is also a persuasive one, score conversion separately.
What does this look like in practice?
A pattern we see when owners score their own site for the first time: Arrive gets a 2, because the homepage has been optimised, and Complete gets a 0. The enquiry form sits for several seconds with no feedback after Send is pressed, and nobody had noticed because staff never use it.
Fixing the form so that it confirms at once is often a small job with an outsized effect, because everyone it affects had already decided to get in touch. Across client work at Global Bridge Labs (GBL), we have seen a 2.4x enquiry rate from conversion changes like these.
Speed scorecard checklist
- Pick your three highest-traffic landing pages.
- Use a mid-range phone on mobile data with stored data cleared.
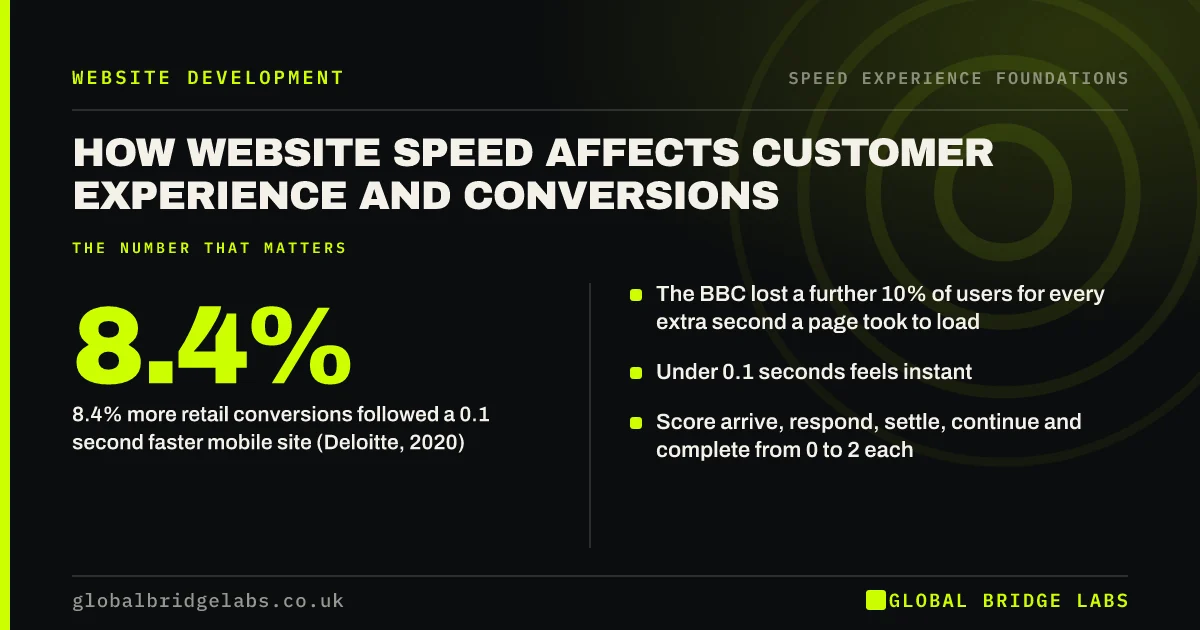
- Score Arrive, Respond, Settle, Continue and Complete from 0 to 2.
- Take the lowest result for each area across the three pages.
- Check LCP, INP and CLS field data in PageSpeed Insights.
- Fix the lowest-scoring area first and re-score in a month.
Next step
An hour with a phone will tell you more about your website's speed than a year of automated reports. If you would like a second opinion on the score, or help with the fixes, we can do both.
Message us on WhatsApp and we will score your site on the GBL Speed Experience Scorecard and send back the three fixes worth making first.
Chat on WhatsApp →Sources and further reading
- About PageSpeed Insights · Google for Developers
- Understanding Core Web Vitals and Google search results · Google Search Central
- PageSpeed Insights · Google
- Web Vitals: essential metrics for a healthy site · web.dev (Google)
Frequently asked questions
How do I score my website's speed?
Open your three main landing pages on a mid-range phone over mobile data. Score five areas from 0 to 2: how quickly the first screen appears, whether taps respond, whether the page stays still, whether later pages are as quick, and whether forms confirm promptly. The total is out of 10.
What is a good website speed score?
On the GBL Speed Experience Scorecard, 8 to 10 means the site is fast where it counts. 5 to 7 means it is quick in places but leaking enquiries, and 4 or below means slowness is costing customers. This is separate from the PageSpeed Insights score, which rates one page in a lab test.
Is a scorecard better than PageSpeed Insights?
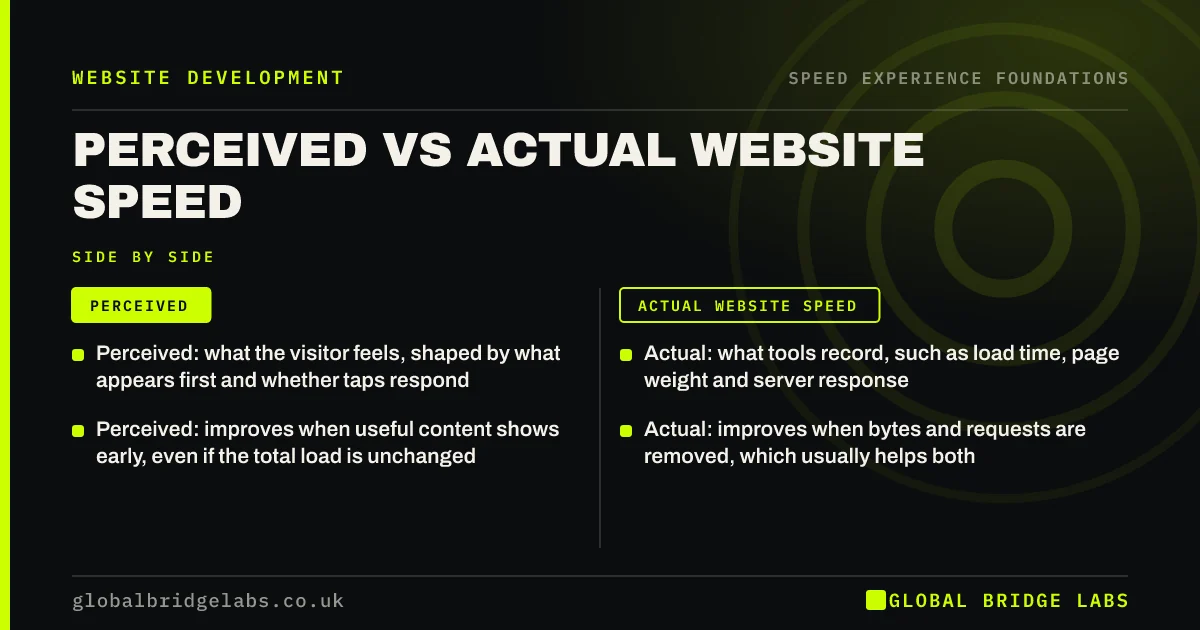
They answer different questions. PageSpeed Insights measures one page precisely and suggests technical fixes. A scorecard covers the whole journey, including menus, later pages and forms, which automated tools do not test. Use the scorecard to find where the problem is and the tool to find the cause.
How often should I test my website speed?
Score the site every quarter, and re-test the affected pages after any change that adds weight, such as a new plugin, tracking tag, chat widget or campaign page. Websites rarely slow down in one step. They slow down through small additions nobody checked.
Written by

Global Bridge Labs (GBL) is a UK–Sri Lanka partner for social media, websites and BPO. Everything here comes from client delivery, not theory.