On this page
- 01Key takeaways
- 02Why is there no speed report in GA4?
- 03How do you link speed to enquiries without extra setup?
- 04How do you send Core Web Vitals to GA4?
- 05What can GA4 tell you about speed indirectly?
- 06When is custom speed tracking not worth it?
- 07What does this look like in practice?
- 08GA4 and speed checklist
- 09Next step
- 10Sources and further reading
- 11Frequently asked questions
Key takeaways
Google Analytics 4 (GA4) has no site speed report. The page timings report that existed in the older Universal Analytics was not carried over. You have two options: read speed in the tools built for it and compare with GA4's behaviour data by page, or add a small script that sends Core Web Vitals into GA4 as events. For most small businesses, the first is enough.
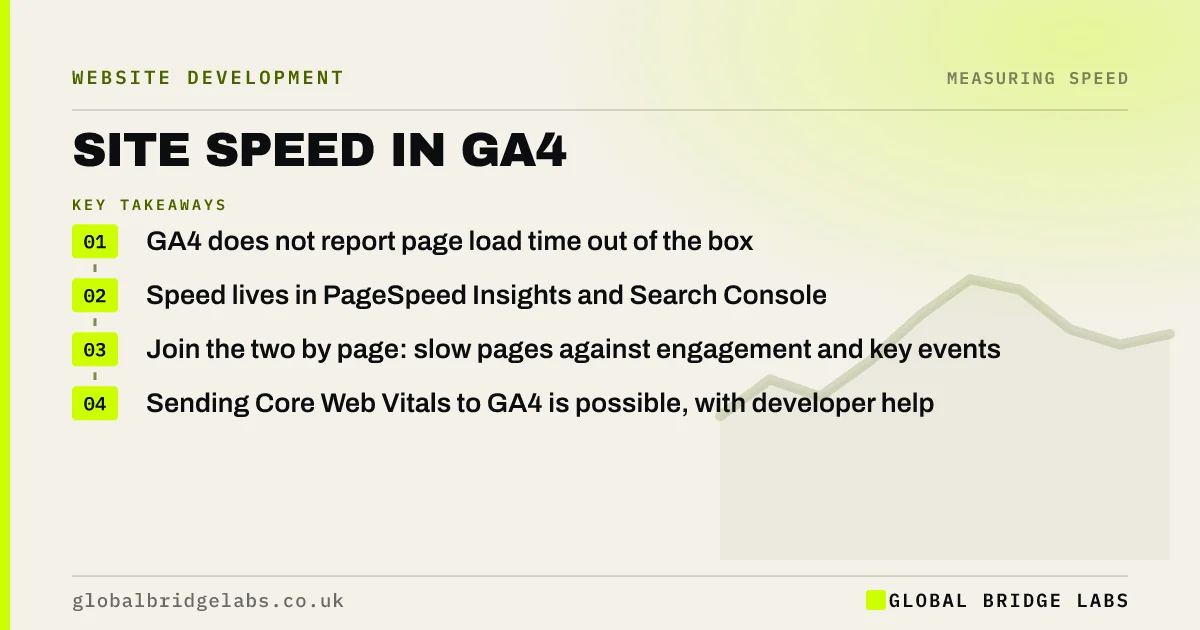
- GA4 does not report page load time out of the box.
- Speed lives in PageSpeed Insights and Search Console. Behaviour lives in GA4.
- Join the two by page: slow pages against engagement and key events.
- Sending Core Web Vitals to GA4 is possible, with developer help.
Want speed and enquiries shown side by side for your pages? Message us on WhatsApp.
Chat on WhatsApp →Why is there no speed report in GA4?
GA4 was built around events and user journeys, and Google did not include the site speed reports that Universal Analytics offered. It directs speed measurement to tools designed for it: PageSpeed Insights, the Chrome User Experience Report and Search Console's Core Web Vitals report.
This catches out anyone who used to check average page load time in analytics. The figure has not moved. It has gone.
How do you link speed to enquiries without extra setup?
Put two reports next to each other. From GA4, export landing pages with sessions, engagement rate and key events, split by device. From Search Console or PageSpeed Insights, note which of those pages pass or fail Core Web Vitals on mobile.
- 1. List your top ten landing pages by sessions.
- 2. Add mobile engagement rate and key event rate for each.
- 3. Mark each page good, needs improvement or poor for LCP, INP and CLS.
- 4. Look for slow pages with weak mobile engagement and strong desktop results.
- 5. Fix those first and compare the same figures after 28 days.
- Website speed and bounce rate: how load time drives exits
- Mobile and desktop in GA4: find where phones lose enquiries
Want this table built for your site? Ask us on WhatsApp.
Chat on WhatsApp →How do you send Core Web Vitals to GA4?
A developer can add Google's open-source web-vitals script, which measures Largest Contentful Paint, Interaction to Next Paint and Cumulative Layout Shift in each visitor's browser and sends them to GA4 as events. Google's web.dev documents the method.
The benefit is your own field data for every page, including pages with too little traffic to appear in Google's public data, and the ability to compare speed with conversions for the same sessions. The cost is setup time, a little extra script and analysis that usually needs a spreadsheet or BigQuery.
What can GA4 tell you about speed indirectly?
GA4 shows the consequences of slowness, not the cause. Very short sessions, low engagement on mobile compared with desktop for the same page, and a gap between ad clicks and recorded sessions all point towards a loading problem.
Treat these as prompts to test, not as proof. A page can lose visitors quickly because it is slow or because it is the wrong page for the search.
When is custom speed tracking not worth it?
Custom tracking is not worth it when the site has modest traffic and nobody will analyse the data. Adding a script to measure speed, on a site slowed by too many scripts, needs a reason. There is also a consent point: analytics events generally require the visitor's agreement under UK rules, so the data will cover only those who accept.
For a typical service business, a quarterly table of ten pages gives the same decisions with far less effort.
What does this look like in practice?
A pattern we see when speed and analytics are reported separately: the developer says the site is fast, the marketer says mobile visitors do not convert, and neither report mentions the other. Put side by side, three landing pages stand out. They fail on mobile loading and have the weakest mobile engagement on the site.
That single table usually settles which pages to fix. Across client work at Global Bridge Labs (GBL), we have seen a 2.4x enquiry rate from conversion changes like these.
GA4 and speed checklist
- Stop looking for a speed report in GA4.
- Export top landing pages with engagement and key events by device.
- Add Core Web Vitals status for each page.
- Flag slow pages with weak mobile engagement.
- Fix, wait 28 days and compare.
- Add custom speed events only if someone will use them.
Next step
Speed data and enquiry data are far more useful together than apart. We will build the table for your top pages and show you where they meet.
Message us on WhatsApp for a speed and enquiry comparison of your landing pages.
Chat on WhatsApp →Sources and further reading
- Measure and debug performance with Google Analytics 4 and BigQuery · web.dev (Google)
- About key events · Google Analytics Help
- Engagement rate and bounce rate · Google Analytics Help
- Core Web Vitals report · Search Console Help
Frequently asked questions
Where is site speed in GA4?
There is no built-in site speed report in Google Analytics 4. The page timings reports from Universal Analytics were not carried over. Use PageSpeed Insights and Search Console's Core Web Vitals report for speed, and GA4 for behaviour and enquiries.
Can GA4 measure page load time?
Not by default. A developer can add Google's web-vitals script to send Largest Contentful Paint, Interaction to Next Paint and Cumulative Layout Shift to GA4 as events. That gives you your own field data, at the cost of setup and analysis time.
How do I see whether slow pages lose enquiries?
List your top landing pages with mobile engagement rate and key events from GA4, then add each page's Core Web Vitals status. Pages that are slow on mobile and convert much worse than on desktop are the ones where speed is likely costing enquiries.
Is Search Console or GA4 better for website speed?
Search Console, for speed itself. Its Core Web Vitals report uses real-visitor data and groups pages as good, needs improvement or poor. GA4 is better for seeing what visitors did once they arrived. Use both, joined by page, so slow pages can be set against enquiries.
Written by

Global Bridge Labs (GBL) is a UK–Sri Lanka partner for social media, websites and BPO. Everything here comes from client delivery, not theory.