On this page
- 01Key takeaways
- 02What does the PageSpeed Insights score measure?
- 03What is a good score?
- 04Why is the score not the goal?
- 05Which results should you act on?
- 06When is chasing a higher score worth it?
- 07What does this look like in practice?
- 08PageSpeed score checklist
- 09Next step
- 10Sources and further reading
- 11Frequently asked questions
Key takeaways
A PageSpeed Insights score of 90 or above is rated good, 50 to 89 needs improvement and below 50 is poor. For a business, the score is the least important thing on the page. What matters is whether real visitors pass the three Core Web Vitals shown above it. A page scoring 65 that passes in the field is healthier than one scoring 92 that fails.
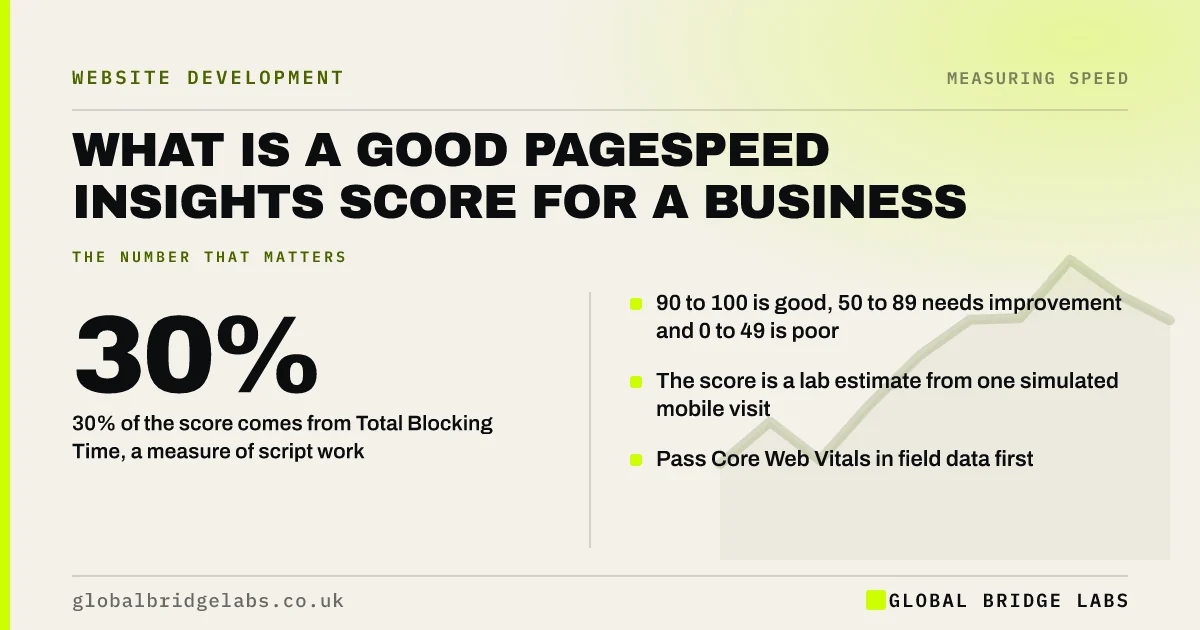
- 90 to 100 is good, 50 to 89 needs improvement and 0 to 49 is poor.
- The score is a lab estimate from one simulated mobile visit.
- 30% of the score comes from Total Blocking Time, a measure of script work.
- Pass Core Web Vitals in field data first. Treat the score as a guide.
Been given a score and no explanation? Send it to us on WhatsApp.
Chat on WhatsApp →What does the PageSpeed Insights score measure?
The performance score is a single number from 0 to 100 produced by Lighthouse, summarising how quickly one page loaded in one simulated test on a mid-range phone and a throttled connection.
It is a weighted blend of five lab measurements. In the current version, Total Blocking Time counts for 30%, Largest Contentful Paint for 25%, Cumulative Layout Shift for 25%, First Contentful Paint for 10% and Speed Index for 10%.
What is a good score?
Lighthouse colours the score in three bands: 90 to 100 is good, 50 to 89 needs improvement and 0 to 49 is poor. Mobile scores are almost always lower than desktop scores for the same page, because the simulated phone is slower.
As a working guide for a business site with normal features such as analytics, a consent banner and a contact form, a mobile score in the 60s to 80s alongside passing field data is a sound result. A mobile score below 50 usually means real visitors are waiting.
Why is the score not the goal?
The score is not the goal for three reasons. It is not what Google's ranking systems use: they use field data from real visitors. It varies from run to run, sometimes by several points, with no change to the site. And it can be raised by tricks that do nothing for customers, or by removing features that earn money.
The part of the report worth your attention is the list of diagnostics beneath the score, which names the specific images, scripts and third parties costing time.
Want the diagnostics turned into a ranked fix list? Ask us on WhatsApp.
Chat on WhatsApp →Which results should you act on?
Read the report from the top and act in this order.
- 1. Core Web Vitals assessment: passed or failed for real users.
- 2. Any of LCP, INP or CLS marked poor or needs improvement.
- 3. The largest savings listed under opportunities.
- 4. Third-party code and its blocking time.
- 5. The score itself, as a rough before-and-after check.
When is chasing a higher score worth it?
Chasing a higher score is worth it while the improvements are also things a visitor would feel: a faster first screen, quicker taps, a steadier page. It stops being worth it when the remaining points require removing a booking tool, delaying the analytics you rely on or rebuilding a working site.
A competitor's higher score is not a reason either. Compare what visitors experience, not the number.
What does this look like in practice?
A pattern we see in web design contracts: the supplier is asked to deliver a score of 90, and does, on the homepage, on desktop, on launch day. Six months later the mobile service pages sit in the 40s, because that was never measured and nobody was watching.
A requirement to pass Core Web Vitals on mobile for named page types, checked at launch and after 28 days, is harder to game and closer to what customers feel. Global Bridge Labs (GBL) writes speed targets this way.
PageSpeed score checklist
- Test on the mobile tab.
- Read the Core Web Vitals assessment before the score.
- Run the test three times and note the range.
- List the top three opportunities and diagnostics.
- Fix what a visitor would feel.
- Stop when field data passes and the page feels quick.
Next step
A score is a summary, and summaries hide the useful part. We will read the full report for your key pages and tell you what is worth doing.
Message us on WhatsApp for a plain-English reading of your PageSpeed report.
Chat on WhatsApp →Sources and further reading
- Lighthouse performance scoring · Chrome for Developers
- About PageSpeed Insights · Google for Developers
- Understanding Core Web Vitals and Google search results · Google Search Central
- PageSpeed Insights · Google
Frequently asked questions
What is a good PageSpeed Insights score?
90 to 100 is rated good, 50 to 89 needs improvement and below 50 is poor. For most business sites, passing the Core Web Vitals assessment for real users matters more than reaching 90, and a mobile score in the 60s to 80s with passing field data is a sound result.
Do I need a PageSpeed score of 100?
No. The score is a lab estimate, not what Google uses for ranking, and the final points usually require removing useful features. Aim to pass Core Web Vitals on mobile for the pages that bring enquiries, then spend effort elsewhere.
How is the PageSpeed Insights score calculated?
It is a weighted blend of five lab measurements from Lighthouse: Total Blocking Time at 30%, Largest Contentful Paint at 25%, Cumulative Layout Shift at 25%, First Contentful Paint at 10% and Speed Index at 10%.
Why is my mobile score so much lower than desktop?
The mobile test simulates a mid-range phone on a slower connection, so the same page takes longer to load and run its scripts. Mobile is the result to act on, because most visitors are on phones and Google indexes the mobile version.
Written by

Global Bridge Labs (GBL) is a UK–Sri Lanka partner for social media, websites and BPO. Everything here comes from client delivery, not theory.