On this page
- 01Key takeaways
- 02Which website metrics actually signal a redesign?
- 03What thresholds should trigger action?
- 04Which metrics mislead?
- 05How do you separate site problems from market problems?
- 06How often should you review these metrics?
- 07What can metrics not tell you?
- 08How do you build a simple monthly metrics sheet?
- 09What does this look like in practice?
- 10Redesign metrics checklist
- 11Next step
- 12Sources and further reading
- 13Frequently asked questions
Key takeaways
Four metrics matter most when deciding on a redesign: qualified enquiries, enquiry rate on key pages, mobile Core Web Vitals, and search impressions for your core services. A sustained decline in two or more, after fixes in place have been tried, is a stronger redesign signal than any single figure.
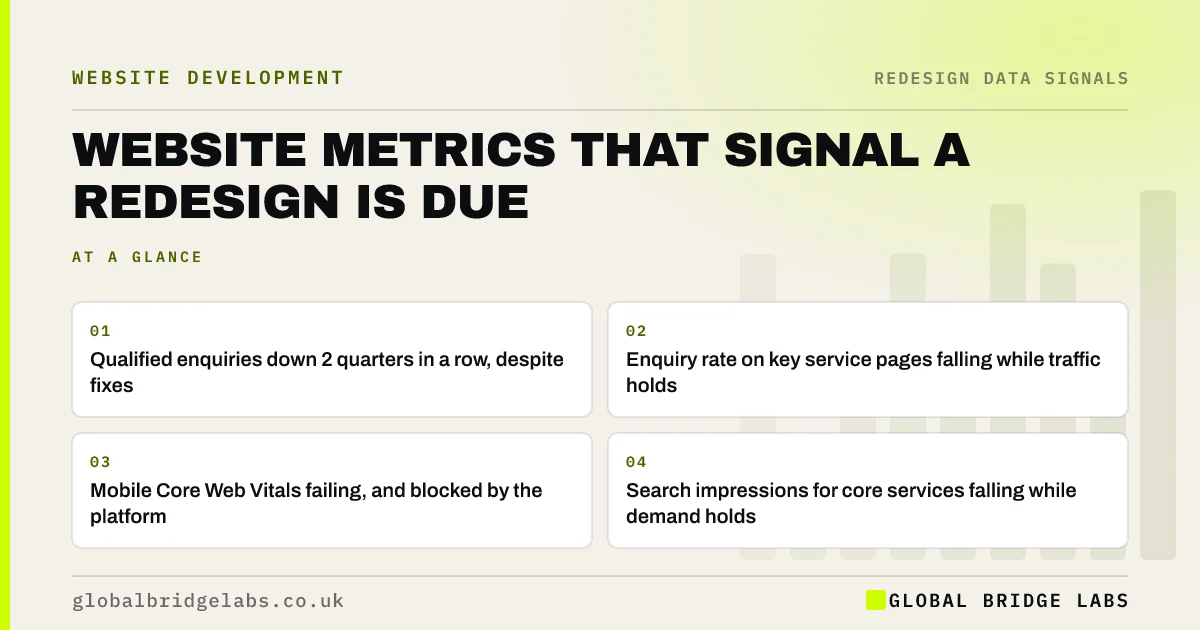
- Qualified enquiries down 2 quarters in a row, despite fixes.
- Enquiry rate on key service pages falling while traffic holds.
- Mobile Core Web Vitals failing, and blocked by the platform.
- Search impressions for core services falling while demand holds.
Want these four metrics pulled for your site? Message us on WhatsApp.
Chat on WhatsApp →Which website metrics actually signal a redesign?
The metrics that signal a redesign are the ones tied to outcomes and to the site's structure: qualified enquiries, enquiry rate on key pages, mobile Core Web Vitals and search impressions for core services. A sustained decline in two or more of them, after fixes in place, suggests the site itself has fallen behind.
What thresholds should trigger action?
Use your own history as the baseline, and compare like with like across the same months of the year. These are working thresholds from our audit practice.
- Qualified enquiries: down more than 20% year on year for two quarters.
- Enquiry rate on top service pages: down by a third while traffic is steady.
- Core Web Vitals: key templates failing on mobile for three months.
- Search impressions for core service terms: down 25% while demand is flat.
Which metrics mislead?
Sitewide averages mislead most. Sitewide bounce rate, total page views and average session duration mix pages with different jobs and traffic with different intent, so they move for reasons that have nothing to do with the site's quality.
- Total sessions: can rise with irrelevant traffic.
- Sitewide bounce rate: dominated by blog and contact pages.
- Time on site: longer can mean confusion, not interest.
- Follower-style vanity numbers such as newsletter sign-ups with no follow-up.
Not sure which of your numbers to trust? Ask us on WhatsApp.
Chat on WhatsApp →How do you separate site problems from market problems?
Check demand before blaming the site. If search impressions for your services fell alongside enquiries, demand dropped. If impressions held but clicks and enquiries fell, the site or its search listing is losing out. Referral and repeat enquiries give a second check: if they fell too, look at the market.
How often should you review these metrics?
Monthly for enquiries and enquiry rate, quarterly for Core Web Vitals and search impressions. A short monthly check catches problems while they can still be fixed in place, which is how most redesigns are avoided.
What can metrics not tell you?
Why people did not enquire. Numbers show where visitors leave; they rarely show the reason. Pair the metrics with five short user tests or customer conversations before committing to a redesign, so you know what to change and not just where.
How do you build a simple monthly metrics sheet?
Use one spreadsheet with a row per month and a column for each of the four core metrics. Fill it in from GA4, Search Console and your enquiry log in 20 minutes on the first working day of each month. Add a notes column for anything that changed: ad spend, a new page, a price rise.
Colour any cell that is more than 20% below the same month last year. Two coloured months in a row in the same column is your trigger to investigate, and two columns coloured for two quarters is a trigger to consider a redesign. The sheet turns a vague feeling about the website into a record anyone can read.
- One row per month, one column per core metric.
- Fill it in on the first working day of the month.
- Add notes for anything that changed.
- Flag drops of more than 20% year on year.
What does this look like in practice?
A pattern in UK professional services: sessions are up, so the site looks healthy, but qualified enquiries are down a quarter year on year. The breakdown shows new blog traffic is masking a fall in visits to service pages, whose enquiry rate has also dropped. The fix is the service pages, not the blog.
Redesign metrics checklist
Pull these four numbers every quarter.
- Qualified enquiries, year on year.
- Enquiry rate on the top five service or landing pages.
- Mobile Core Web Vitals for key templates.
- Search impressions for core service terms.
- Flag any that have declined for two quarters.
- Try fixes in place before treating them as redesign signals.
Next step
If you want to know whether your numbers point to a redesign, we will pull the four metrics with you in 30 minutes and tell you what they say.
Message us on WhatsApp for a metrics review, or book a 30-minute consultation.
Chat on WhatsApp →Sources and further reading
- About key events · Google Analytics Help
- Performance report (Search results) · Search Console Help
- Understanding Core Web Vitals and Google search results · Google Search Central
Frequently asked questions
What metrics show a website needs a redesign?
Qualified enquiries falling for two quarters, enquiry rate on key pages dropping while traffic holds, mobile Core Web Vitals failing because of the platform, and search impressions for core services falling while demand is steady. A decline in two or more, after fixes, is a strong signal.
What are the most important website KPIs for a small business?
Qualified enquiries or orders per month, enquiry rate, cost per enquiry and the share of enquiries worth quoting. Traffic, bounce rate and engagement time are diagnostics that help explain changes, not goals in their own right. Review them monthly so problems are caught early.
How do I know if my website is performing well?
Compare qualified enquiries and enquiry rate with the same months last year, check key pages pass Core Web Vitals on mobile, and confirm search impressions for your core services are stable or growing. If all four hold, the site is performing.
Can analytics tell me why visitors are leaving?
Analytics shows where visitors leave but rarely why. Combine it with heatmaps, session recordings, a handful of user tests or conversations with recent customers to understand the reason before deciding what to change. Watch recordings of real sessions before deciding what to change.
Written by

Global Bridge Labs (GBL) is a UK–Sri Lanka partner for social media, websites and BPO. Everything here comes from client delivery, not theory.