On this page
- 01Short answer
- 02What is a website KPI?
- 03Why do most website reports change nothing?
- 04Which website goals suit which businesses?
- 05How do you calculate enquiry rate and cost per enquiry?
- 06What are realistic website benchmarks for UK SMEs?
- 07When do vanity metrics actually matter?
- 08What does this look like in practice?
- 09Your website KPI checklist
- 10Next step
- 11Sources and further reading
- 12Frequently asked questions
Short answer
Website KPIs for a small business should be few and commercial: one goal, such as qualified enquiries per month, supported by enquiry rate, cost per enquiry and the share of visits from the right audience. Traffic, bounce rate and time on page are diagnostics that explain a change, not goals.
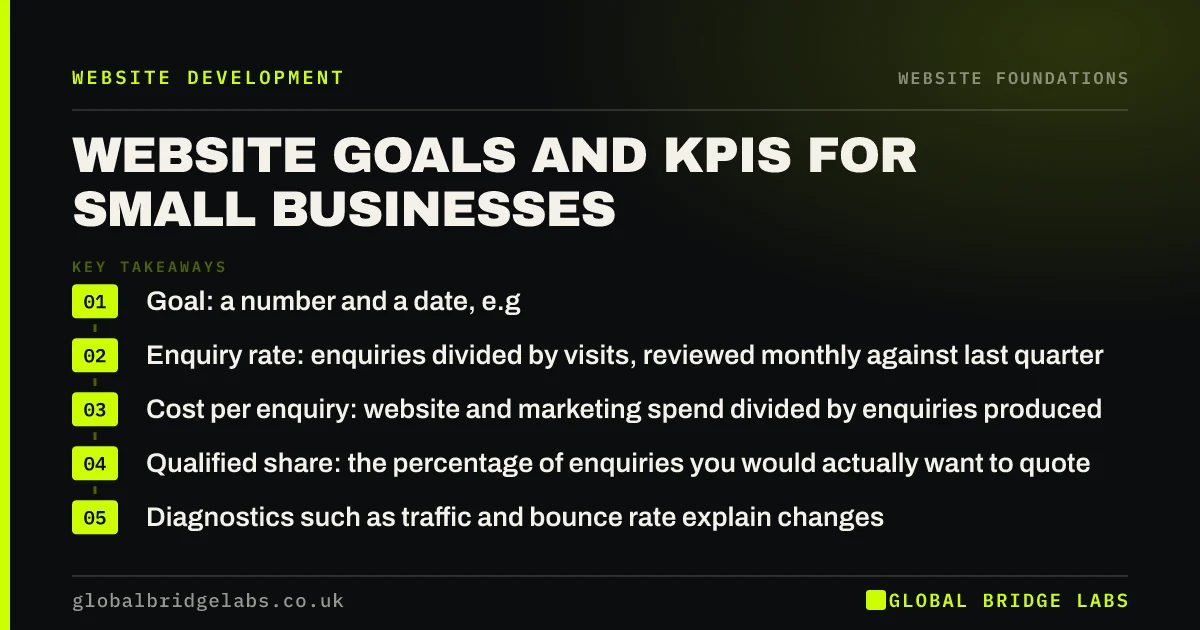
- Goal: a number and a date, e.g. 40 qualified enquiries a month by March.
- Enquiry rate: enquiries divided by visits, reviewed monthly against last quarter.
- Cost per enquiry: website and marketing spend divided by enquiries produced.
- Qualified share: the percentage of enquiries you would actually want to quote.
- Diagnostics such as traffic and bounce rate explain changes but are never targets.
Want a KPI set built around your own numbers? Message us on WhatsApp with last month's enquiries and visits.
Chat on WhatsApp →What is a website KPI?
A website KPI (key performance indicator) is a single measured number that shows whether the website is moving a commercial outcome the business has already agreed matters, such as enquiries, bookings or orders.
The test of a KPI is whether a change in it would change a decision. If enquiry rate halves, you would investigate the site. If average time on page drops by ten seconds, you would probably do nothing, which tells you it is not a KPI.
Why do most website reports change nothing?
Most website reports change nothing because they describe activity rather than outcomes. A monthly PDF showing sessions, page views and bounce rate invites one question, did that produce any work, and the report cannot answer it.
The second failure is that enquiries are not tracked at all. Phone calls, WhatsApp chats and form submissions arrive in different places, so the website gets credit for none of them and the owner assumes it produces nothing.
- Reports built from whatever the analytics tool shows by default.
- No key events set for forms, calls or WhatsApp clicks.
- No comparison with the previous period, so no trend.
- No link between the website and the sales or booking system.
Which website goals suit which businesses?
Match the goal to how the business makes money. These four cover almost every UK SME we work with, and each has a primary KPI that the whole site can be judged against.
- Service business (trades, clinics, professional services): qualified enquiries per month.
- Booking business (hospitality, appointments): completed online bookings per month.
- E-commerce: revenue from the site and conversion rate, alongside average order value.
- Recruitment-heavy business: completed job applications per vacancy and cost per hire.
How do you calculate enquiry rate and cost per enquiry?
Enquiry rate is total enquiries from the website divided by total visits, expressed as a percentage. Cost per enquiry is everything you spend to get and run the website in a month, divided by the enquiries it produced that month.
Worked example: 1,200 visits and 36 enquiries is a 3% enquiry rate. If hosting, maintenance and paid traffic cost £900 that month, cost per enquiry is £25. Compare that with what a lead from a directory or paid search costs you before deciding whether the site is expensive.
Count every channel. A phone click on mobile, a WhatsApp tap and a form submission are all enquiries. Google Analytics 4 can record each as a key event, which is the name GA4 now uses for what used to be called conversions.
What are realistic website benchmarks for UK SMEs?
Treat published benchmarks as a sanity check, not a target. As a rough working range, UK lead generation sites convert 2% to 5% of visits into enquiries, focused landing pages with paid traffic can reach higher, and e-commerce sites typically convert 1% to 3% of sessions into orders.
The benchmark that matters most is your own last quarter. Traffic mix changes everything: a site whose visitors mostly search your brand name will convert far better than one whose visitors arrive from a broad blog post. Segment before you compare.
Send us a month of visits and enquiries on WhatsApp and we will tell you your real cost per enquiry.
Chat on WhatsApp →When do vanity metrics actually matter?
Traffic, bounce rate, engagement time and page views are useful as diagnostics. If enquiries fall, they help you find out why: did traffic drop, did the wrong people arrive, or did the right people arrive and leave?
The trade-off is attention. Every metric on a report takes time to read and discuss. Keep diagnostics in a second tab and look at them only when a KPI moves, so the monthly meeting stays about the number that pays the bills.
What does this look like in practice?
A pattern in professional services firms: a monthly agency report of 14 pages, with traffic up and a green arrow on almost every chart, while the partners cannot say whether the site produced a single client.
The fix is dull and effective. Key events for the contact form, phone clicks and the booking link. One sheet with enquiries, enquiry rate, qualified share and cost per enquiry, month by month. Traffic and rankings move to an appendix. Within two months the conversation shifts from whether the site looks modern to which service page needs better proof.
Your website KPI checklist
Set this up once and review it on the same day every month.
- Write one goal with a number and a date.
- List every enquiry channel: form, phone, WhatsApp, booking, email.
- Create a GA4 key event for each channel.
- Record monthly visits, enquiries and qualified enquiries in one sheet.
- Calculate enquiry rate and cost per enquiry each month.
- Compare with the previous three months, not with industry averages.
- Change one thing on the site per month and note what it was.
Next step
If your reports are full of numbers but short on answers, we will set up a one-page website KPI view with you in 30 minutes, built around enquiries and cost per enquiry.
Message us on WhatsApp for a one-page website KPI template, or book a 30-minute consultation.
Chat on WhatsApp →Sources and further reading
- About key events · Google Analytics Help
- Google Search Console · Google
- SEO Starter Guide · Google Search Central
Frequently asked questions
What KPIs should I track for my business website?
Track qualified enquiries or orders per month, enquiry rate (enquiries divided by visits), cost per enquiry, and the share of enquiries that are worth quoting. Keep traffic, bounce rate and engagement time as diagnostics you look at only when one of those four numbers moves.
Is website traffic a good KPI?
Not on its own. Traffic tells you how many people arrived, not whether they were the right people or whether they did anything. Use traffic to explain a change in enquiries, and always look at it alongside enquiry rate so a rise in irrelevant visitors is not mistaken for progress.
What is a key event in Google Analytics 4?
A key event is an action in Google Analytics 4 that you have marked as important to the business, such as a form submission, a phone click or a completed booking. It replaced the term conversion in GA4 and it is the basis for measuring what your website actually produces.
How often should I review website performance?
Monthly for KPIs, using the same definitions each time, and quarterly for a wider review of pages, content and technical health. Weekly reviews tend to react to noise on small business sites, because a few enquiries either way can look like a trend when they are not.
Written by

Global Bridge Labs (GBL) is a UK–Sri Lanka partner for social media, websites and BPO. Everything here comes from client delivery, not theory.