On this page
- 01Key takeaways
- 02What is a control chart?
- 03Why does it matter?
- 04How do you build one?
- 05How do you read it?
- 06What does it look like in practice?
- 07When is a control chart overkill?
- 08What does this look like in practice?
- 09Control chart checklist
- 10Next step
- 11Sources and further reading
- 12Frequently asked questions
Key takeaways
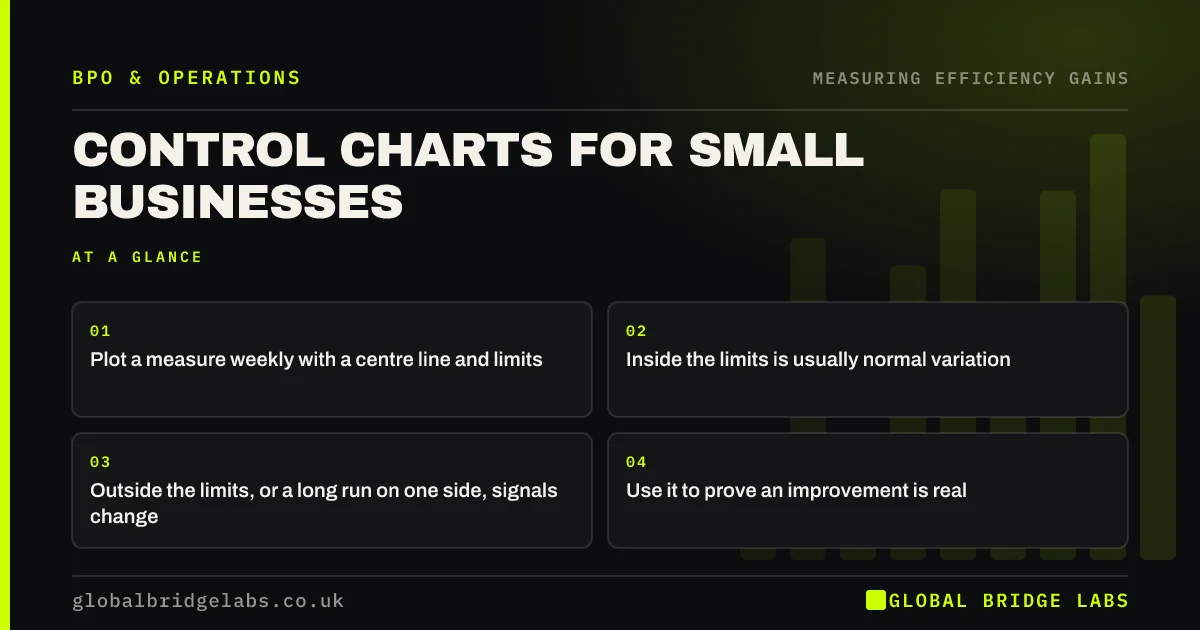
A control chart plots a measure over time with a centre line and upper and lower limits based on its normal variation. Points inside the limits are usually noise; points outside, or long runs on one side, signal a real change. It stops businesses overreacting to one bad week and helps prove that an improvement, such as outsourcing a process, really worked.
- Plot a measure weekly with a centre line and limits.
- Inside the limits is usually normal variation.
- Outside the limits, or a long run on one side, signals change.
- Use it to prove an improvement is real.
Want a control chart built from your weekly data? Message us on WhatsApp.
Chat on WhatsApp →What is a control chart?
A control chart is a line chart of a process measure over time, with a centre line at the average and control limits above and below, usually set at three standard deviations. It was developed by Walter Shewhart at Bell Laboratories in the 1920s and is the core tool of statistical process control.
Why does it matter?
Every process varies from week to week. Without a control chart, managers react to normal ups and downs as if they were problems, which wastes time and unsettles teams. A control chart separates common-cause variation, the normal noise, from special-cause variation, a real change worth acting on.
How do you build one?
Take at least 15 to 20 weeks of a measure, such as right-first-time rate or lead time. Calculate the average and the standard deviation. Draw the centre line at the average and the limits at three standard deviations above and below. Plot each new week as it arrives. A spreadsheet is enough.
- 1. Collect 15 to 20 weeks of one measure.
- 2. Calculate average and standard deviation.
- 3. Draw centre line and limits.
- 4. Plot each new week.
- 5. Look for points outside limits or long runs.
How do you read it?
A point outside the limits signals something unusual that week. A run of about seven or eight points on one side of the centre line suggests the process has shifted. A steady trend up or down over several weeks suggests drift. Anything else is usually normal variation, so leave it alone.
What does it look like in practice?
In an illustrative example, weekly lead time for invoices averages four days with limits of two and six days. After a process is handed to a managed team, the next nine weeks all sit below the centre line, between one and two days. That run confirms a real shift, not a lucky few weeks. Example figures only.
Want to check whether a recent change really worked? Send us your weekly numbers on WhatsApp.
Chat on WhatsApp →When is a control chart overkill?
It is overkill for measures that change rarely, for processes with very few items a week, or when a simple trend line already makes the picture clear. Use it where people argue about whether a change is real.
What does this look like in practice?
A pattern we see: a manager calls a meeting every time a weekly figure dips, and the team spends time explaining noise. A control chart shows most dips are within normal range, and the meetings stop until a real signal appears.
Control chart checklist
Use these to get started.
- Pick one important weekly measure.
- Collect 15 to 20 weeks of data.
- Draw the centre line and limits.
- Act only on clear signals.
- Recalculate limits after a real change.
Next step
Send us 15 to 20 weeks of one measure. We will build a simple control chart and show you whether recent changes are real.
Message us on WhatsApp about control charts, or book a 30-minute consultation.
Chat on WhatsApp →Sources and further reading
- Labour productivity · Office for National Statistics
- The Green Book: appraisal and evaluation in central government · HM Treasury
Frequently asked questions
What is a control chart?
A control chart is a line chart of a process measure over time with a centre line at the average and upper and lower control limits. It shows whether changes are normal variation or a real shift. It was developed by Walter Shewhart in the 1920s.
What is the difference between common cause and special cause variation?
Common cause variation is the normal, random ups and downs in any process. Special cause variation comes from a specific event or change, such as a new system or a staff shortage. Control charts help tell them apart so you act only on real changes.
Can a small business use control charts?
Yes. A spreadsheet with 15 to 20 weeks of one measure is enough to calculate the average and limits. It is especially useful for confirming that an improvement, such as outsourcing a process, has really changed performance.
Written by

Global Bridge Labs (GBL) is a UK–Sri Lanka partner for social media, websites and BPO. Everything here comes from client delivery, not theory.