On this page
Key takeaways
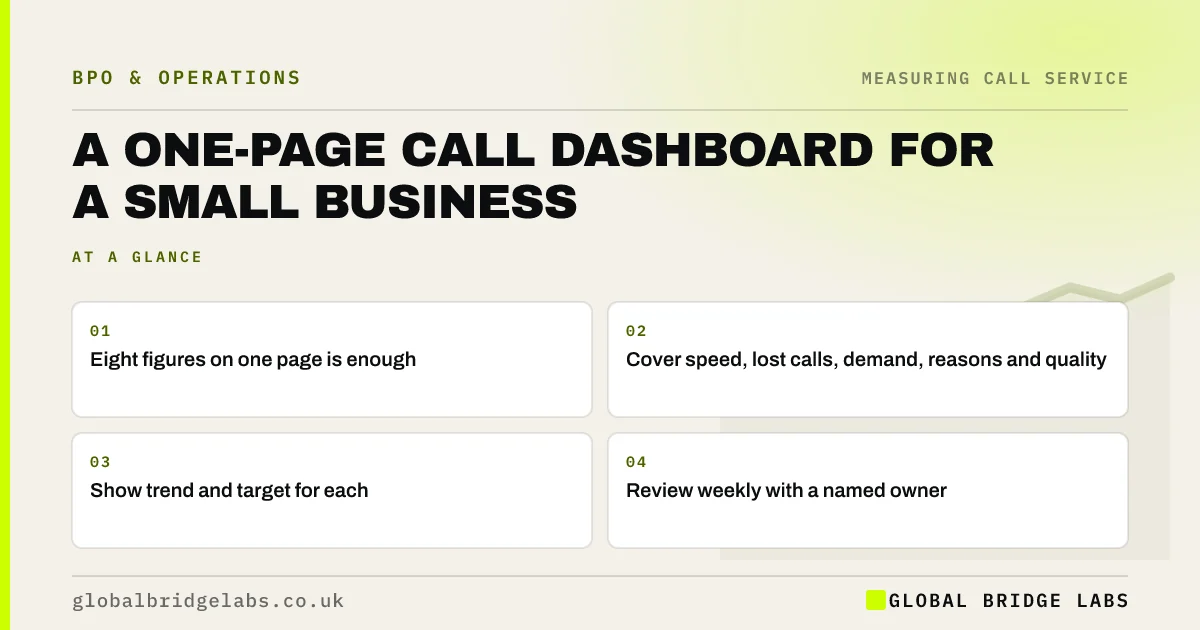
A small business does not need a wall of call statistics. One page with about eight figures, covering speed, lost calls, demand, reasons and quality, is enough to run a phone line well. Show each figure with its trend and target, split the key ones by half hour and review the page weekly with whoever owns the service level.
- Eight figures on one page is enough.
- Cover speed, lost calls, demand, reasons and quality.
- Show trend and target for each.
- Review weekly with a named owner.
Want a call dashboard set up? Message us on WhatsApp.
Chat on WhatsApp →Which figures should it show?
Choose figures that lead to action. A typical small business set covers how quickly calls were answered, how many were lost, why people called and whether they were helped.
- Calls offered.
- Service level.
- Abandonment rate.
- Longest wait.
- Top five call reasons.
- Repeat call rate.
- Quality score from sampled calls.
- Callback completion.
How should it be laid out?
Put the headline figures at the top with this week, last week and target. Below them, a half-hour grid of service level shows where the week went wrong. A small Pareto chart of reasons shows what drove demand. Keep colours simple: one for on target, one for off.
Where does the data come from?
Most of it comes from your phone system reports, with reasons from call codes and quality from a weekly sample of calls. A spreadsheet updated once a week is enough to start; many cloud phone systems can export straight into one.
Want your first dashboard built from your phone data? Send us an export on WhatsApp.
Chat on WhatsApp →How should you use it?
Review it weekly in a short meeting with the person who owns the target. Ask three questions: where did we miss, why, and what will we change this week? A dashboard that nobody acts on is just decoration.
What does this look like in practice?
A pattern we see: an owner receives a 12-page monthly call report and reads only the first page. Replacing it with a one-page weekly dashboard means problems are spotted within days, not weeks, and the team starts discussing fixes rather than figures.
The shorter report also makes it easier to compare providers or teams, because everyone reports the same eight figures in the same way.
Call dashboard checklist
- Pick about eight figures.
- Show this week, last week and target.
- Add a half-hour service level grid.
- Add a Pareto chart of reasons.
- Review weekly and agree one action.
Next step
List the figures you get today, choose eight from the set above and build a one-page sheet you can update in under 30 minutes a week.
Message us on WhatsApp to set up a call dashboard, or book a 30-minute consultation.
Chat on WhatsApp →Sources and further reading
- Measuring success · GOV.UK Service Manual
- UK Customer Satisfaction Index · Institute of Customer Service
Frequently asked questions
What are the most important call centre metrics for a small business?
Service level, abandonment rate, longest wait, calls offered, top call reasons, repeat calls and a quality measure from listening to calls. Together they show how fast you answer, how many callers you lose, why people call and whether they were helped. Start with these before adding more.
How often should I update a call dashboard?
Weekly suits most small businesses. It is frequent enough to spot problems early and act, without taking much time. Watch the queue live during the day for urgent issues, and run a deeper review of reasons and trends once a month.
Do I need special software for a call dashboard?
Not at first. A spreadsheet fed by exports from your phone system works well. Dashboards built into cloud phone systems or helpdesks can save time once you know which figures matter. Choose the figures first, then the tool, not the other way round.
Written by

Global Bridge Labs (GBL) is a UK–Sri Lanka partner for social media, websites and BPO. Everything here comes from client delivery, not theory.