On this page
Key takeaways
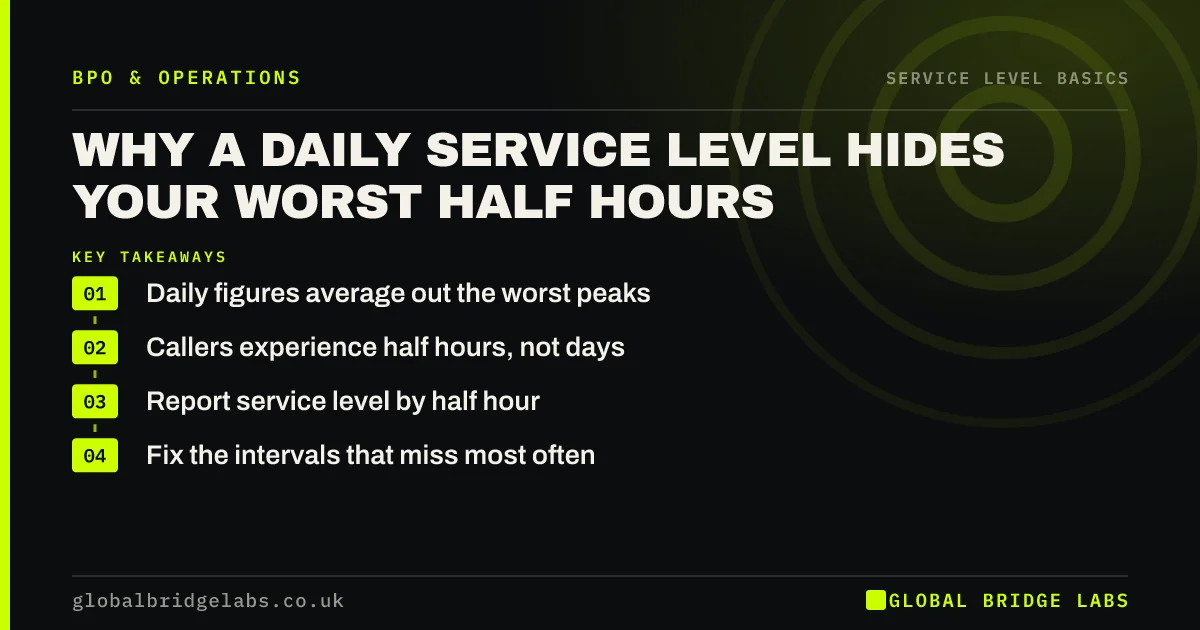
A daily service level is an average of many half hours, and most of them are quiet. A day can show 85/20 while the Monday 9am half hour sits at 40%. Callers remember the bad half hour, not the daily figure. Report service level by half hour, find the intervals that miss, and staff or fix those first.
- Daily figures average out the worst peaks.
- Callers experience half hours, not days.
- Report service level by half hour.
- Fix the intervals that miss most often.
Want your call data split by half hour? Message us on WhatsApp.
Chat on WhatsApp →Why does the daily figure hide problems?
Quiet half hours are easy to answer quickly, and there are many of them. Busy half hours have more calls, but a daily percentage can still look healthy if the rest of the day is calm. The result is a report that looks fine and a peak that callers complain about.
What is an interval report?
An interval report shows calls offered, answered, abandoned and service level for each half hour, or sometimes each 15 minutes. Laid out as a grid of days by half hours, it quickly shows patterns such as a weak lunchtime or a poor first hour on Mondays. Most cloud phone systems can export it.
How do you read it?
Look for half hours that miss the target on most days, not one-off bad days. Then check calls offered in those intervals against the number of people actually available. Usually the gap comes from breaks, meetings or a predictable rush that the rota does not reflect.
- Colour cells that miss the target.
- Look for repeats across the week.
- Compare calls with people available.
Want help reading your interval report? Send it to us on WhatsApp.
Chat on WhatsApp →How do you fix the weak intervals?
Move breaks and meetings out of the busy half hours, bring in part-time or cross-trained cover for predictable peaks, and use overflow or callbacks for spikes. Then check whether a few call reasons cause the peak, because some, such as payment or delivery questions, can be prevented.
What does this look like in practice?
A pattern we see: a team reports 84/20 for the month. The interval grid shows 12:30 to 14:00 below 55% every weekday. Staggering lunches and moving a weekly meeting to the afternoon lifts those intervals above 75% without any new hire.
Interval reporting checklist
- Export service level by half hour.
- Lay it out as days by half hours.
- Highlight intervals below target.
- Check people available in those intervals.
- Fix breaks and meetings first.
Next step
Export four weeks of half-hourly data, highlight the intervals below target, and fix the three most frequent misses before changing anything else.
Message us on WhatsApp to review your interval data, or book a 30-minute consultation.
Chat on WhatsApp →Sources and further reading
- Measuring success · GOV.UK Service Manual
- UK Customer Satisfaction Index · Institute of Customer Service
Frequently asked questions
Should I report service level every 15 or 30 minutes?
Half-hourly is enough for most small teams and matches how rotas are usually planned. Fifteen-minute intervals help busy teams with sharp peaks, such as the first minutes after opening. Very small teams can use hourly intervals, because half-hour figures based on a handful of calls jump around too much.
What if only a few calls arrive in each half hour?
Small numbers make half-hourly percentages noisy, so one late call can swing the figure. Combine four weeks of the same half hour, or report hourly instead. The aim is to spot repeated patterns, not to react to a single bad interval with two calls in it.
Can a provider report by interval?
Most can, and you should ask for it. A monthly headline alone is not enough to see where callers wait. Ask for a half-hourly grid each week or month, with calls offered, answered, abandoned and service level, using the formula you agreed.
Written by

Global Bridge Labs (GBL) is a UK–Sri Lanka partner for social media, websites and BPO. Everything here comes from client delivery, not theory.