On this page
Key takeaways
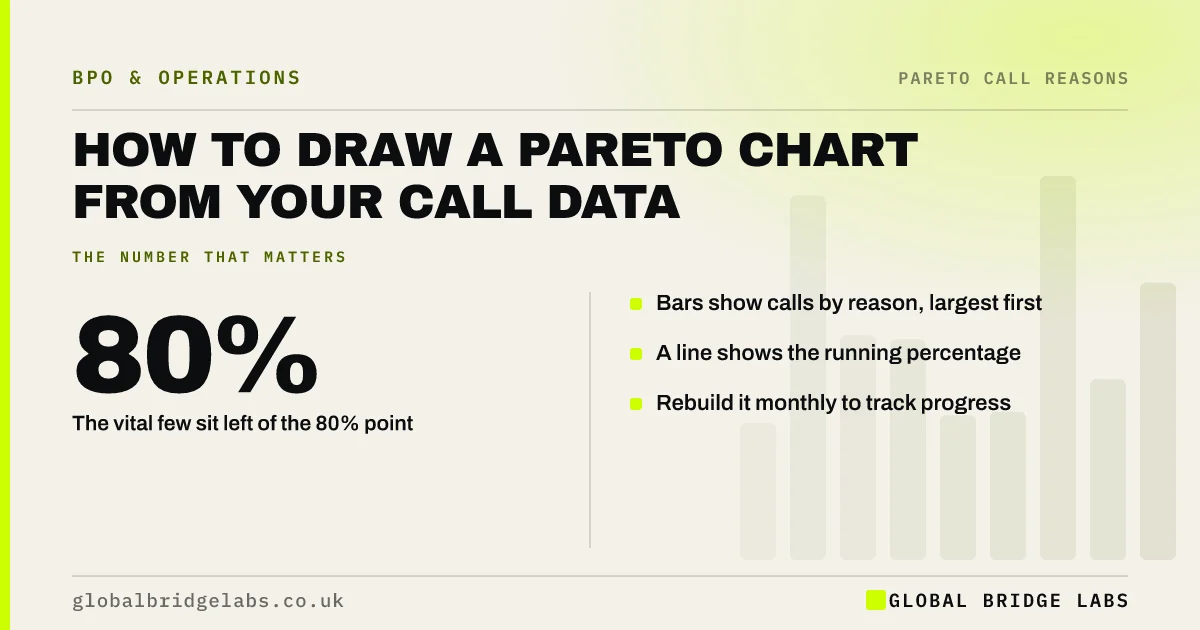
A Pareto chart shows call reasons as bars from largest to smallest, with a line for the running percentage. It makes the vital few reasons obvious at a glance. You can build one in any spreadsheet from four weeks of coded calls in about 15 minutes, then use it each month to track whether your fixes are working.
- Bars show calls by reason, largest first.
- A line shows the running percentage.
- The vital few sit left of the 80% point.
- Rebuild it monthly to track progress.
Want a Pareto chart built from your call data? Message us on WhatsApp.
Chat on WhatsApp →What goes into the chart?
You need two columns: call reason and number of calls, from at least four weeks of coded calls. Sort them from most to least. Add a third column for each reason's share of the total, and a fourth for the running total of those shares.
How do you build it in a spreadsheet?
Any spreadsheet can do this in five steps, and many also offer a built-in Pareto chart type that does them for you.
- Sort reasons by call count, largest first.
- Add share and running total columns.
- Insert a combined chart: bars for counts, a line for the running total.
- Put the line on a second axis from 0 to 100%.
- Draw a guide at 80%.
How do you read it?
Look at where the line crosses 80%. The reasons to its left are your vital few. If the line rises slowly with no clear drop in bar height, your reasons may be too broad or too detailed, so revisit the codes. If one bar dominates, start there.
Want help reading your chart? Send it to us on WhatsApp.
Chat on WhatsApp →What should you watch out for?
Volume alone can mislead. A reason with fewer calls may take much longer to handle or lead to complaints. Build a second chart weighted by handling time, and compare the two before deciding what to fix first.
What does this look like in practice?
A pattern we see: the count chart puts delivery questions first, but the time-weighted chart puts billing disputes first, because each one takes much longer. The team fixes delivery texts quickly and starts a slower piece of work on clearer invoices.
Pareto chart checklist
- Use four weeks of coded calls.
- Sort reasons largest first.
- Add running total on a second axis.
- Draw a guide at 80%.
- Build a time-weighted version too.
Next step
Export four weeks of coded calls, build the chart, and pick the reason with the biggest bar on both the count and time-weighted versions.
Message us on WhatsApp to turn your call data into a Pareto chart, or book a 30-minute consultation.
Chat on WhatsApp →Sources and further reading
- Value Stream Mapping Overview · Lean Enterprise Institute
- Measuring success · GOV.UK Service Manual
Frequently asked questions
Can I make a Pareto chart in Excel?
Yes. Recent versions of Excel include a Pareto chart type under statistical charts, which sorts the bars and adds the running total line. In other spreadsheets, build it as a combined bar and line chart with the line on a second axis from 0 to 100%.
What if my chart has no clear vital few?
Your reason codes may be too broad or too detailed. Broad codes hide the real causes, and very detailed ones spread calls thinly. Revisit the codes, merge or split them, and collect another four weeks. A clear pattern usually appears once codes describe why customers call.
Should I chart by calls or by handling time?
Do both. Calls show how often a reason appears; handling time shows how much staff time it uses. A reason with fewer but longer calls can cost more than a common short one. Comparing the two charts gives a better basis for choosing what to fix.
Written by

Global Bridge Labs (GBL) is a UK–Sri Lanka partner for social media, websites and BPO. Everything here comes from client delivery, not theory.