On this page
Key takeaways
The marketing efficiency ratio (MER) is total revenue divided by total marketing spend over the same period. It ignores platform attribution and asks one question: is the business earning more for each pound spent on marketing? Track it monthly alongside cost per enquiry, and judge social spend by whether MER holds as spend rises.
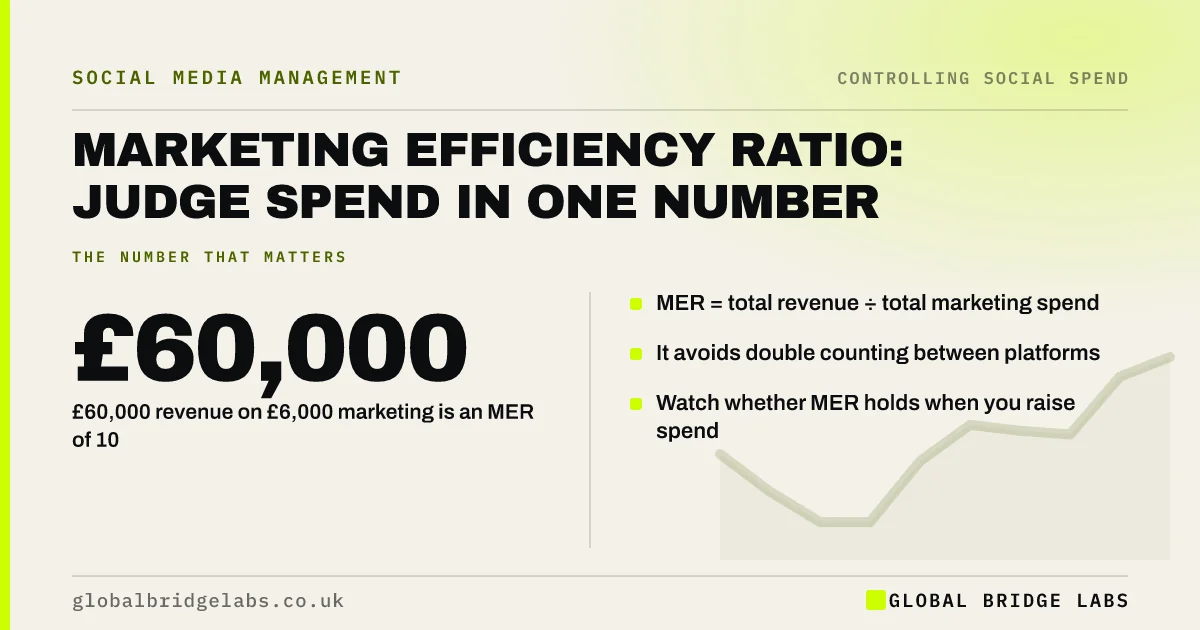
- MER = total revenue ÷ total marketing spend.
- £60,000 revenue on £6,000 marketing is an MER of 10.
- It avoids double counting between platforms.
- Watch whether MER holds when you raise spend.
Want your MER worked out? Message us on WhatsApp.
Chat on WhatsApp →How do you calculate MER?
Add every marketing cost for the month, including social media ads, fees, tools, search ads and print, and divide total revenue by that figure. Illustrative example: £60,000 revenue and £6,000 marketing gives an MER of 10. Use the same period and VAT treatment for both.
Why use MER as well as ROAS?
Each platform claims credit for sales within its own attribution window, so the platform totals often add up to more than you actually sold. MER uses the business's own figures. If platform ROAS rises but MER falls, the platforms are claiming sales that would have happened anyway.
What is a good MER?
It depends on margin and how much repeat business arrives without marketing. As a rough guide, divide 1 by your gross margin for a floor: at 40% margin, an MER below 2.5 means marketing costs more than the gross profit it brings in. Most healthy small businesses sit well above that floor.
Send us your revenue, margin and marketing spend on WhatsApp and we will discuss your requirements.
Chat on WhatsApp →What are MER's limits?
It cannot tell you which channel works, and seasonal swings or referrals can move it without any marketing change. Use it as the top-line check, then use cost per enquiry by channel to decide where money goes. Compare the same month year on year where seasons matter.
What does this look like in practice?
A pattern we see: a business doubles social ad spend, the platform reports strong returns, but total revenue barely moves. MER falls, revealing that the extra spend mostly reached existing buyers. Pulling back to the earlier level usually restores MER without losing sales.
MER checklist
- List every marketing cost each month.
- Divide total revenue by total marketing spend.
- Set a floor from 1 ÷ gross margin.
- Compare MER before and after spend changes.
- Use cost per enquiry by channel for allocation.
Next step
Work out MER for each of the last six months. Mark the months when social spend changed and see whether MER moved with it.
Message us on WhatsApp with your figures, or book a 30-minute consultation.
Chat on WhatsApp →Sources and further reading
- Get started with attribution · Google Analytics Help
- About Conversions API · Meta
Frequently asked questions
What is the marketing efficiency ratio?
The marketing efficiency ratio (MER) is total revenue divided by total marketing spend over the same period. It shows how much revenue the business earns for each pound spent on marketing, without relying on any platform's attribution. Many online businesses track it monthly.
Is MER better than ROAS?
They answer different questions. ROAS shows how a single campaign or platform performs by its own counting. MER shows whether total marketing is working for the whole business. Use MER as the overall check and ROAS or cost per enquiry to compare campaigns.
Does MER work for service businesses?
Yes, if you can match revenue to the period it was marketed in. Services with long sales cycles may need a quarterly or rolling three-month MER, because marketing in one month often turns into revenue several weeks or months later.
Written by

Global Bridge Labs (GBL) is a UK–Sri Lanka partner for social media, websites and BPO. Everything here comes from client delivery, not theory.