On this page
Key takeaways
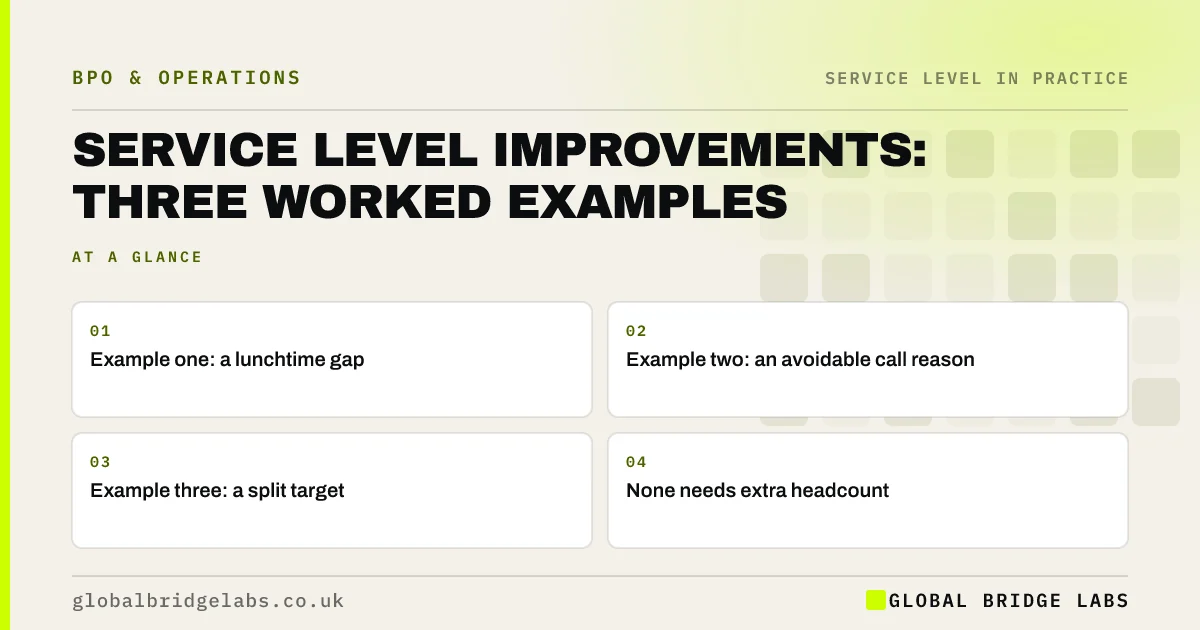
These three illustrative examples show different routes to a better service level: fixing a lunchtime staffing gap, removing an avoidable call reason and splitting one target into two. None needs extra headcount. Figures are illustrative, not client data, but each pattern is common in UK small businesses.
- Example one: a lunchtime gap.
- Example two: an avoidable call reason.
- Example three: a split target.
- None needs extra headcount.
Want to know which example fits your business? Message us on WhatsApp.
Chat on WhatsApp →Example one: the lunchtime gap
A five-person team meets 80/20 for the month but lunchtime falls below 50%, because everyone lunches between 12:30 and 13:30. Staggering lunches in three waves from 11:30 to 14:30 lifts lunchtime to above 75% and complaints about waiting fall. Illustrative example.
Example two: the avoidable reason
A service business takes 1,200 calls a month; 18%, about 216, are rescheduling requests. Adding a change link to reminder texts halves them, removing about 108 calls. At five minutes each, that frees around nine hours a month, mostly in the morning peak. Illustrative example.
Example three: the split target
A firm sets 90/10 for all lines and misses it most days. Splitting the target, 90/10 on new enquiries and 80/30 on account queries, with one more person on enquiries at peak, means both targets are met and enquiry abandonment falls. Illustrative example.
Want your own example worked through? Send us your call data on WhatsApp.
Chat on WhatsApp →What do the examples have in common?
Each started by splitting data by half hour or reason, rather than reading the monthly figure. Each fixed a cause, not just a symptom. And each measured the result over four weeks before moving on.
What does this look like in practice?
A pattern we see: owners expect service level fixes to mean hiring. In most reviews, the first improvements come from timing, demand and targets. Hiring becomes the right answer only once those are fixed and demand still exceeds capacity.
Those first fixes also make any later hire more effective, because the new person joins a team whose rota and demand are already in good shape.
Writing down each example's before and after figures also helps the team see what worked, and makes the case for the next change easier to agree.
Improvement examples checklist
- Split data by half hour.
- Look for a timing gap.
- Look for an avoidable reason.
- Check whether targets suit each line.
- Measure for four weeks after each fix.
Next step
Check your data for each of the three patterns: a timing gap, an avoidable reason and a target that does not fit a line. Start with whichever you find first.
Message us on WhatsApp to improve your service level, or book a 30-minute consultation.
Chat on WhatsApp →Sources and further reading
- Measuring success · GOV.UK Service Manual
- Stop trying to delight your customers (Dixon, Freeman and Toman, 2010) · Harvard Business Review
Frequently asked questions
Can service level improve without hiring?
Often, yes. Moving breaks away from peaks, removing avoidable calls, adding callbacks and setting the right target for each line can all lift service level without more people. Hiring makes sense once these are fixed and demand still exceeds capacity in key half hours.
How long do improvements take to show?
Timing changes, such as staggered breaks, often show within a week or two. Demand fixes, such as reminder texts, may take a full cycle of messages to show. Measure four weeks before and after each change, and compare the same half hours.
Are these examples typical?
They are illustrative, not client data, but the patterns are common: a lunchtime gap, an avoidable call reason and a target that does not fit every line. Your own data will show which apply to you. Use the 80/20 service review to find them.
Written by

Global Bridge Labs (GBL) is a UK–Sri Lanka partner for social media, websites and BPO. Everything here comes from client delivery, not theory.