On this page
Key takeaways
Pareto analysis ranks call reasons from most to least common, so you can see the vital few that create most of your calls. In many teams a handful of reasons, such as order updates, billing questions and password resets, make up most of the volume. Fixing even one of them at source can lift service level more than a new hire.
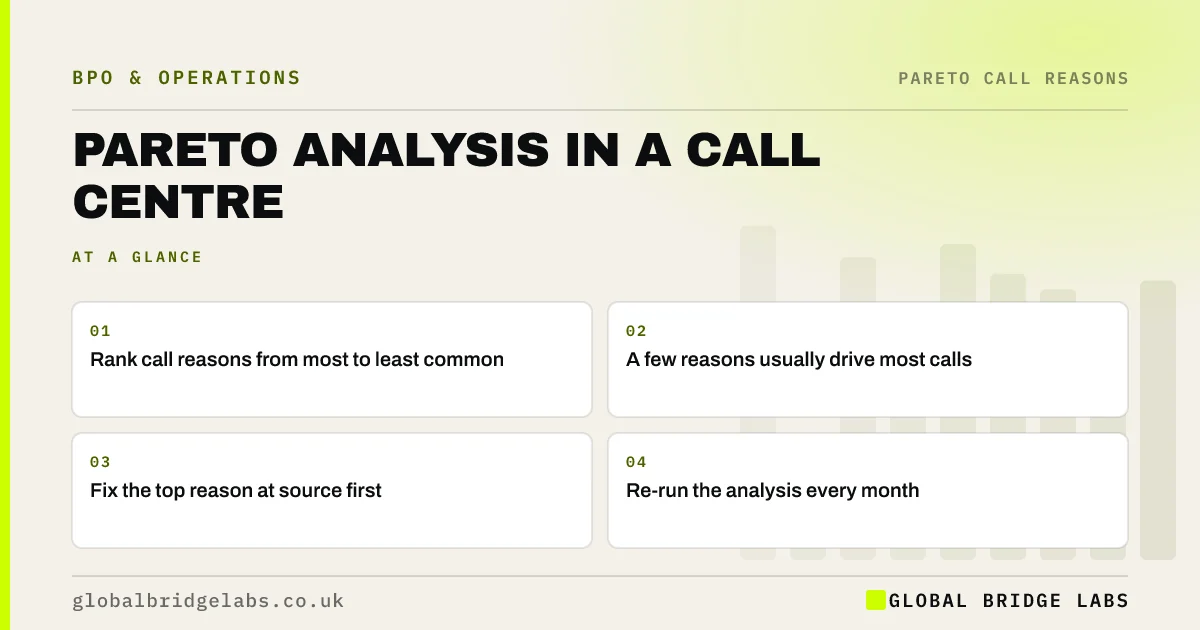
- Rank call reasons from most to least common.
- A few reasons usually drive most calls.
- Fix the top reason at source first.
- Re-run the analysis every month.
Want to know which calls you could prevent? Message us on WhatsApp.
Chat on WhatsApp →What is Pareto analysis for calls?
It applies the Pareto principle, the idea that a small share of causes often produces a large share of effects, to the reasons people call. You count calls by reason, sort them from largest to smallest and add a running total. The split is rarely exactly 80/20, but the pattern of a few big reasons and a long tail is common.
What data do you need?
A reason for each call, recorded consistently. That means a short list of reason codes that staff pick at the end of each call, or a sample of calls coded by listening. Four weeks of data is usually enough to see the pattern clearly.
How do you run it?
Four steps are enough. The reasons that sit before the running total passes 80% are your vital few, and most improvement effort should go there.
- Count calls by reason for four weeks.
- Sort the reasons from most to least.
- Add a running percentage.
- Mark where the running total passes 80%.
Want us to run a Pareto analysis on your call data? Send it to us on WhatsApp.
Chat on WhatsApp →What do you do with the top reasons?
For each one, ask why the customer needed to call. Was something unclear, late or wrong? Could they have found the answer themselves? Could you have told them before they asked? The answers point to fixes such as proactive updates, clearer letters or self-service.
What does this look like in practice?
A pattern we see: four weeks of coded calls show that three reasons, delivery updates, invoice questions and appointment changes, make up about 60% of calls. Automated delivery texts and an online rescheduling link cut those reasons noticeably, and service level improves without a new hire.
Pareto analysis checklist
- Agree a short list of call reasons.
- Code every call for four weeks.
- Sort reasons and add a running total.
- Pick the top one or two to fix.
- Re-run the analysis each month.
Next step
Start coding every call with a reason this week. After four weeks, sort them, find your vital few and choose one to fix at source.
Message us on WhatsApp to find your top call reasons, or book a 30-minute consultation.
Chat on WhatsApp →Sources and further reading
- Value Stream Mapping Overview · Lean Enterprise Institute
- Stop trying to delight your customers (Dixon, Freeman and Toman, 2010) · Harvard Business Review
Frequently asked questions
What is the 80/20 rule for call reasons?
It is the observation that a small share of call reasons often creates a large share of calls. The exact split varies, but most businesses find a handful of reasons dominate. Ranking reasons by volume shows where fixing one problem would prevent the most calls and free the most time.
How many call reasons should I track?
Usually between ten and 20. Fewer than ten and the codes are too broad to act on; more than 20 and staff pick inconsistently. Include an other code, and review what goes into it each month, adding a new reason if one keeps appearing.
How is Pareto analysis different from looking at call logs?
Call logs show when calls arrived and how long they lasted. Pareto analysis adds why people called, then ranks those reasons by volume. It turns raw call data into a short list of problems worth fixing, ordered by how many calls each one would prevent.
Written by

Global Bridge Labs (GBL) is a UK–Sri Lanka partner for social media, websites and BPO. Everything here comes from client delivery, not theory.