On this page
- 01Key takeaways
- 02What should an organic vs paid report include?
- 03Why keep it to one page?
- 04Where should the numbers come from?
- 05How should you present organic and paid together?
- 06What makes a report useful?
- 07What does this look like in practice?
- 08Report checklist
- 09Next step
- 10Sources and further reading
- 11Frequently asked questions
Key takeaways
A useful organic vs paid social report fits on one page: enquiries and customers by source at the top, then organic signals, paid cost per result, total cost, what worked, what did not and decisions for next month. Owners need decisions, not screenshots. If a report does not change anything, it is too long or measuring the wrong things.
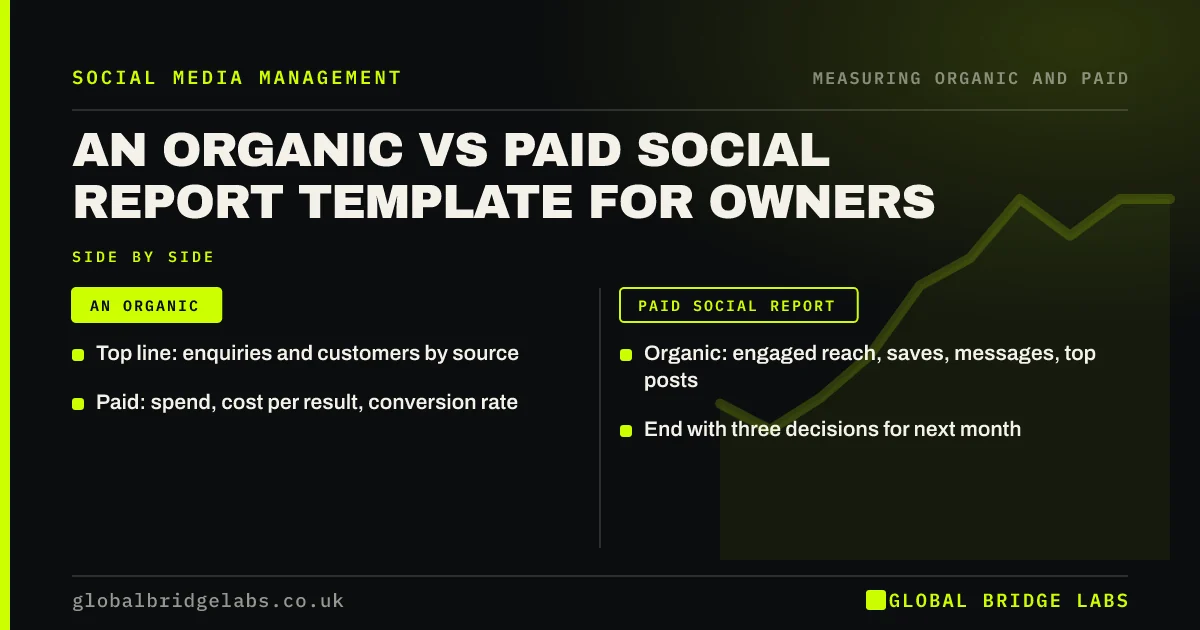
- Top line: enquiries and customers by source.
- Organic: engaged reach, saves, messages, top posts.
- Paid: spend, cost per result, conversion rate.
- End with three decisions for next month.
Want this report template? Message us on WhatsApp.
Chat on WhatsApp →What should an organic vs paid report include?
An organic vs paid report should include the business results first, then the supporting numbers for each, then decisions.
- Enquiries and customers by source.
- Organic: engaged reach, saves, shares, messages.
- Paid: spend, results, cost per result.
- Total cost of social media.
- Top three posts and ads.
- Three decisions for next month.
Why keep it to one page?
One page forces focus on what matters. Owners and directors need to see whether social media is paying back and what will change, not every metric available. Detail can sit in an appendix for those who want it.
Where should the numbers come from?
Enquiries should come from your own records and GA4 key events; organic signals from platform insights; paid figures from the ad platform, cross-checked against GA4. Consistent UTM tags make the GA4 split between organic and paid reliable.
Want your monthly report built on this template? Message us on WhatsApp and we will discuss your requirements.
Chat on WhatsApp →How should you present organic and paid together?
Present them side by side, each with its own KPIs, and a shared row for enquiries and cost per enquiry. Add a short note on trends, since organic changes slowly.
What makes a report useful?
A report is useful when it leads to decisions: promote this post, pause that ad, test a new offer, change the posting rhythm. If the same decisions appear every month, the report has stopped doing its job.
What does this look like in practice?
A pattern we see: a property maintenance company received a 20-page monthly report full of screenshots and read none of it. Replacing it with a one-page summary, enquiries by source, cost per enquiry for paid, top organic posts and three decisions, meant the director actually acted on it.
Report checklist
- Lead with enquiries and customers by source.
- Show organic KPIs separately.
- Show paid spend and cost per result.
- Include total cost of social media.
- List top posts and ads.
- End with three decisions.
Next step
Rebuild next month's social media report on one page using these sections. Share it with whoever makes decisions and agree the three actions before the month starts.
Message us on WhatsApp for the one-page report template, or book a 30-minute consultation.
Chat on WhatsApp →Sources and further reading
- About key events · Google Analytics Help
- URL builders: collect campaign data with custom URLs · Google Analytics Help
- Meta Business Help Centre · Meta
Frequently asked questions
What should a monthly social media report include?
It should include enquiries and customers by source, key organic signals such as engaged reach and messages, paid spend and cost per result, total cost, top-performing content and decisions for next month. Keep it to one page so the decisions are clear.
How often should I get a social media report?
Monthly is right for most small businesses, with a short weekly check for paid campaigns. Quarterly reviews are useful for organic trends and bigger decisions about budget and platforms. Reports more often than monthly usually add noise rather than insight.
Should my agency report organic and paid separately?
They should report each with its own KPIs, but on the same page, with a shared view of enquiries and cost per enquiry. That shows how each contributes and stops either being judged by the wrong measures. Ask for decisions, not just numbers.
Written by

Global Bridge Labs (GBL) is a UK–Sri Lanka partner for social media, websites and BPO. Everything here comes from client delivery, not theory.