On this page
- 01Key takeaways
- 02What is social media engagement rate?
- 03What are the main formulas?
- 04Which formula should a small business use?
- 05What counts as an engagement?
- 06Why compare with yourself, not industry averages?
- 07How does going viral affect engagement rate?
- 08What does this look like in practice?
- 09What does a worked calculation look like?
- 10What are the common calculation mistakes?
- 11Next step
- 12Sources and further reading
- 13Frequently asked questions
Key takeaways
Social media engagement rate is total engagements divided by reach (or followers), multiplied by 100. Use engagement rate by reach for posts, because it measures how people who actually saw the post responded. Compare your rate with your own 12-week average rather than industry averages, which vary widely and are rarely comparable.
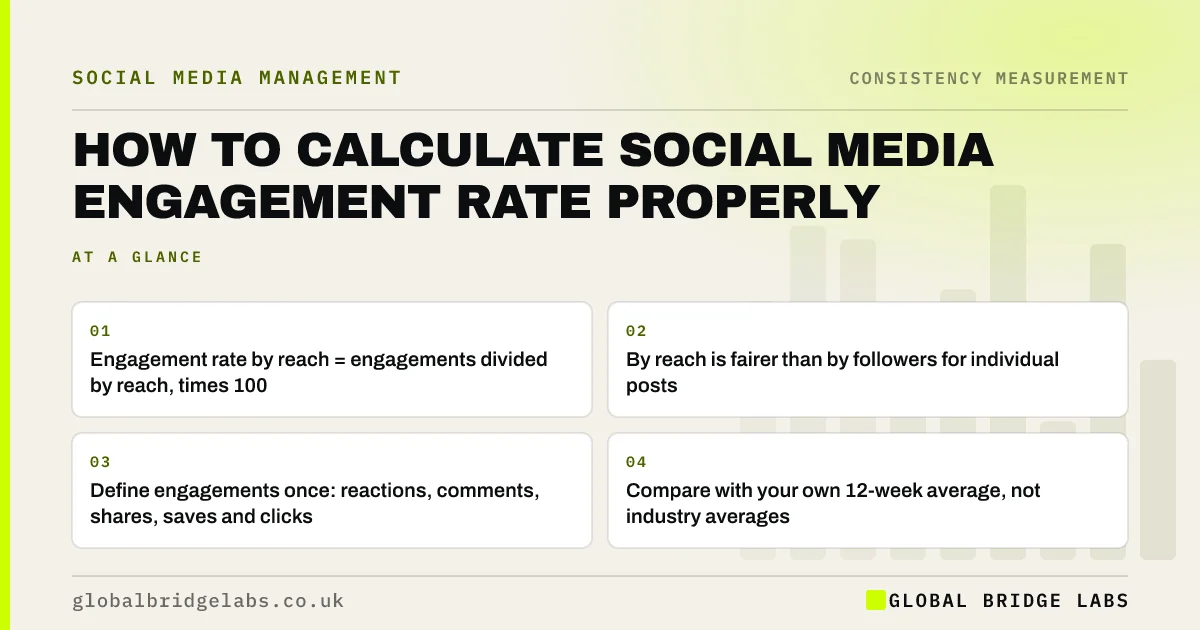
- Engagement rate by reach = engagements divided by reach, times 100.
- By reach is fairer than by followers for individual posts.
- Define engagements once: reactions, comments, shares, saves and clicks.
- Compare with your own 12-week average, not industry averages.
- A viral post often lowers later engagement rates.
Want your engagement rate calculated properly? Send us your analytics on WhatsApp.
Chat on WhatsApp →What is social media engagement rate?
Social media engagement rate is the percentage of people who interacted with your content out of those who saw it or follow you. It is a relative measure, so it lets you compare posts and periods fairly even when reach varies.
What are the main formulas?
- By reach: total engagements divided by reach, times 100. Best for individual posts.
- By impressions: total engagements divided by impressions, times 100. Useful for paid content.
- By followers: total engagements divided by followers, times 100. Useful for comparing accounts.
Which formula should a small business use?
Use engagement rate by reach for posts. It measures how people who actually saw the post responded, which is what you want to improve. Engagement rate by followers penalises posts that reach beyond followers and flatters posts that reach only loyal fans.
Whichever you choose, keep it the same every month. Switching formulas makes trends meaningless.
Want a simple spreadsheet that calculates it for you? Message us on WhatsApp.
Chat on WhatsApp →What counts as an engagement?
Define it once and stick to it. A sensible definition includes reactions, comments, shares, saves and link clicks. Platforms define engagement differently in their own analytics, so calculate it yourself from the underlying numbers if you want consistent comparisons across channels.
Why compare with yourself, not industry averages?
Published industry averages use different formulas, different samples and different definitions, and they are dominated by large accounts. A UK local business with a small, loyal audience may have a much higher rate than an average suggests, or a much lower one, for good reasons. Your own 12-week average is the fairest benchmark.
How does going viral affect engagement rate?
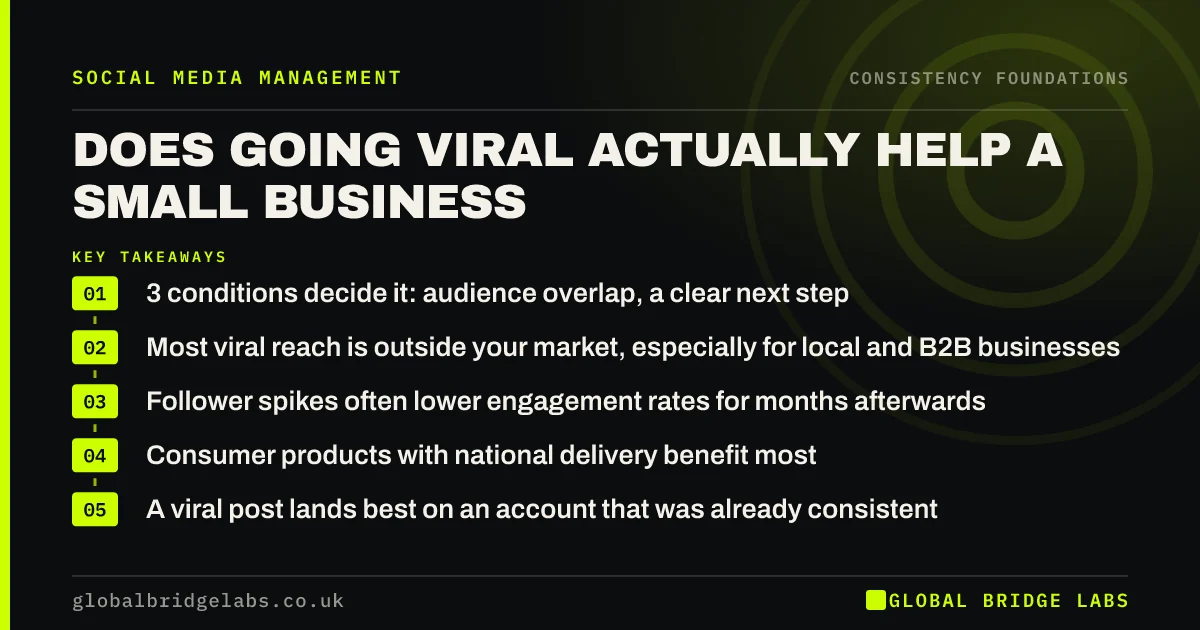
A viral post often has a lower engagement rate than usual, because it reaches many people who are only mildly interested. It can also lower later engagement rates, because new followers attracted by one post engage less with your regular content. Consistent content aimed at a clear audience usually holds a steadier rate.
What does this look like in practice?
A UK e-commerce brand was comparing its Instagram engagement rate with a published average and felt it was underperforming. Recalculated by reach, using its own definition, the rate was stable. The real issue was that one campaign had attracted many irrelevant followers, which the by-followers figure hid. Focusing on consistent product content restored the trend.
What does a worked calculation look like?
A post reaches 1,200 people and receives 30 reactions, 6 comments, 4 shares, 12 saves and 8 link clicks. Total engagements are 60. Engagement rate by reach is 60 divided by 1,200, times 100, which is 5%. If the account has 2,000 followers, engagement rate by followers is 3%.
Record the monthly average across all posts, not individual posts, and compare it with your average for the previous 12 weeks.
What are the common calculation mistakes?
- Mixing formulas from month to month.
- Counting different interactions on different platforms.
- Comparing with published averages that use other formulas.
- Judging on single posts instead of monthly averages.
- Including a viral outlier without noting it.
Next step
Choose one formula and one definition of engagement, calculate your 12-week average and use it as your benchmark from now on.
Message us on WhatsApp and we will set up your engagement rate benchmark.
Chat on WhatsApp →Sources and further reading
- Engagement rate and bounce rate · Google Analytics Help
- Meta Business Help Centre · Meta
- LinkedIn Pages best practices · LinkedIn
Frequently asked questions
How do you calculate engagement rate on social media?
Divide total engagements by reach and multiply by 100 for engagement rate by reach. Alternatively, divide by impressions or followers. Define which interactions count as engagements and keep the formula consistent so trends are meaningful.
What is a good engagement rate for a small business?
It depends on platform, audience and formula, so industry averages are rarely comparable. The best benchmark is your own 12-week average. If your rate is stable or rising while posting consistently to the right audience, it is good for you.
Should I use reach or followers to calculate engagement rate?
Reach, for individual posts. It measures how people who actually saw the post responded. Follower-based rates can be useful for comparing accounts but are distorted when posts reach non-followers.
Why is my engagement rate going down?
Common causes are posting gaps, irrelevant new followers after a viral post or giveaway, content drifting away from your audience, or more promotional posts. Check consistency and audience fit first, then content mix.
Is a high engagement rate always good?
Not always. A high rate from people outside your market does little for the business. Check who is engaging as well as how much. A steady rate from relevant people is more valuable than a high rate driven by giveaways or off-topic content.
Written by

Global Bridge Labs (GBL) is a UK–Sri Lanka partner for social media, websites and BPO. Everything here comes from client delivery, not theory.