On this page
- 01Short answer
- 02What do the free tools already give you?
- 03What is the gap the free tools leave?
- 04When is a paid tool justified?
- 05What about social listening?
- 06What should you spend on tools overall?
- 07Which ten numbers should you record each month?
- 08How do you read analytics without drawing the wrong conclusion?
- 09Next step
- 10Sources and further reading
- 11Frequently asked questions
Short answer
For most UK small businesses, the native platform analytics plus a web analytics tool cover everything you need, at no cost. Paid analytics tools earn their money when you manage several brands, need historical data the platforms do not retain, or must produce client reporting at volume.
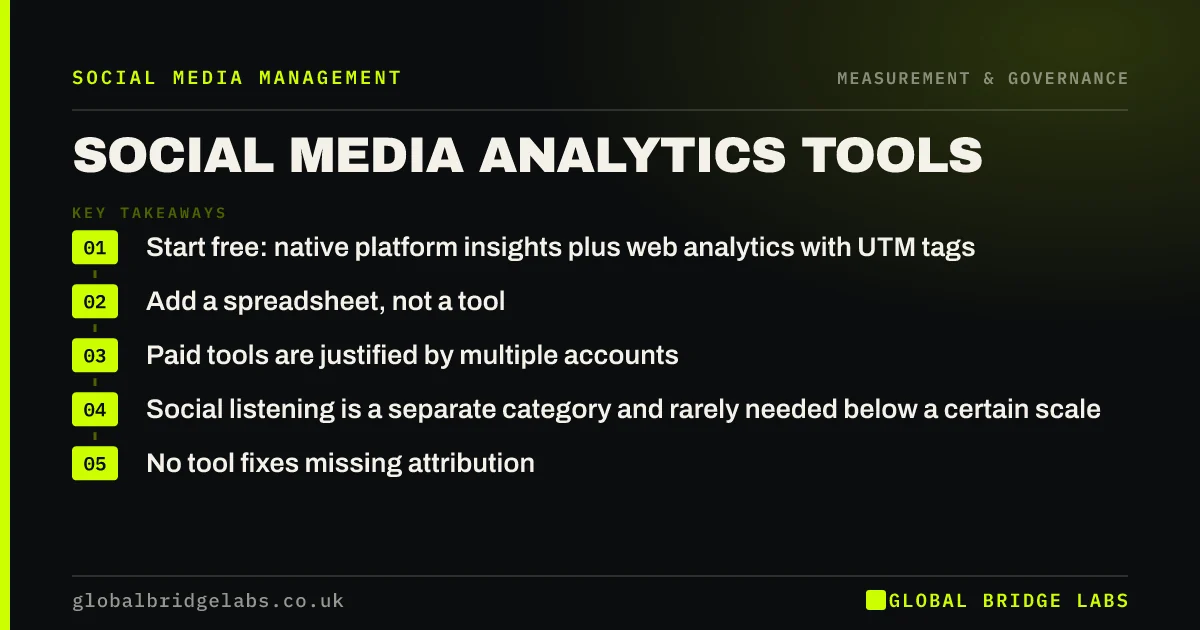
- Start free: native platform insights plus web analytics with UTM tags.
- Add a spreadsheet, not a tool. Monthly figures copied by hand build the history platforms delete.
- Paid tools are justified by multiple accounts, historical depth or reporting volume.
- Social listening is a separate category and rarely needed below a certain scale.
- No tool fixes missing attribution. Fix the enquiry source field first.
Not sure whether to pay for a tool? Ask us on WhatsApp before you subscribe.
Chat on WhatsApp →What do the free tools already give you?
More than most small businesses use. Native insights on each platform cover reach, engagement, audience location and age, best-performing content, and follower changes, with enough history for a quarterly review.
Web analytics covers what happens after the click: which pages social visitors land on, how long they stay, and whether they reach your enquiry page. Combined with UTM tags, that is a complete picture of everything trackable.
What is the gap the free tools leave?
Historical depth. Platforms retain detailed analytics for a limited window, typically weeks to months, which means year-on-year comparison becomes impossible unless you record the figures yourself.
The cheap solution is a spreadsheet updated monthly with ten numbers. Fifteen minutes a month builds a data set that no tool can reconstruct retrospectively, and it costs nothing.
When is a paid tool justified?
Three situations, and a fourth that people mistake for one.
- Managing several brands or locations, where switching between accounts is the real cost.
- Needing historical data beyond platform retention, for genuine year-on-year analysis.
- Producing client-facing reports at volume, where formatting time exceeds the subscription.
- Not justified: hoping a tool will explain why results are poor. That is a strategy question.
What about social listening?
Social listening tools monitor mentions of your brand, competitors and topics across platforms. They are genuinely useful at scale and rarely worth the cost for a business with modest mention volume.
The free version for a small business is a saved search on each platform plus alerts on your brand name, checked weekly. That catches the thing listening tools exist to catch, which is somebody talking about you when they have not tagged you.
We will tell you which tools your setup actually needs, and which it does not. Message us on WhatsApp.
Chat on WhatsApp →What should you spend on tools overall?
£20-£80 a month covers scheduling and design for most UK small businesses, and analytics can usually stay free. Spending more than that on tools while under-investing in production time is the wrong order of priorities.
The honest test: if the tool disappeared tomorrow, would any decision change? If not, cancel it and put the money into content or paid reach.
Which ten numbers should you record each month?
The set that lets you reconstruct a year later what actually happened, collected by hand in about fifteen minutes.
Reach and impressions per channel, follower count and net change, posts published against posts planned, engagement rate on your definition, conversations started, enquiries attributed, paid spend, and the best-performing post with its subject and format.
Posts published against posts planned is the one people leave out and the one that explains most anomalies. A quarter where results dipped is usually a quarter where cadence dropped, and without that column you will spend the review blaming the content.
- Reach and impressions, per channel.
- Followers and net change.
- Posts published versus planned.
- Engagement rate, on a fixed definition.
- Conversations, enquiries, paid spend.
- Best post: subject and format, not just the number.
How do you read analytics without drawing the wrong conclusion?
Three habits separate useful analysis from confident error in small business reporting.
Compare like with like. A month with eleven posts and a month with six are not comparable on total reach, which is why posts published belongs beside every reach figure. Look at medians rather than averages, because one unusual post distorts a small sample badly enough to invent a trend that does not exist. And check whether a change is larger than your normal month-to-month variation before explaining it, since most small accounts move 20-30% either way without anything having changed.
The practical rule: do not explain a movement until you have checked that it is bigger than the noise. Most marketing meetings in small businesses are spent interpreting variance.
- Always show posts published alongside reach.
- Use medians, not averages, on small samples.
- Establish your normal variation before explaining any change.
- Annotate the spreadsheet when something unusual happened. Memory fails by month four.
Next step
Tools are the easiest thing to buy and the least likely to be the constraint. Check the measurement setup first.
Message us on WhatsApp for a review of your analytics setup and what it is missing.
Chat on WhatsApp →Sources and further reading
- URL builders: collect campaign data with custom URLs · Google Analytics Help
- Meta Business Help Centre · Meta
Frequently asked questions
Do I need a paid social media analytics tool?
Usually not. Native platform insights plus web analytics with UTM tags cover everything a single-brand small business needs. Paid tools earn their cost with multiple accounts, historical depth beyond platform retention, or high-volume client reporting.
How long do platforms keep analytics data?
Detailed data is retained for a limited window, typically weeks to a few months depending on platform and metric. Copy ten key numbers into a spreadsheet monthly, since historical data cannot be reconstructed after the platform drops it.
Are social listening tools worth it for small businesses?
Rarely below a reasonable mention volume. Saved searches on each platform plus alerts on your brand name, checked weekly, catch what matters most: people discussing your business without tagging you, which is when problems usually start.
What should a small business spend on social media tools?
£20-£80 a month for scheduling and design, with analytics usually staying free. If a tool disappeared tomorrow and no decision would change, cancel it and move the money into content production or paid reach.
Written by

Global Bridge Labs (GBL) is a UK–Sri Lanka partner for social media, websites and BPO. Everything here comes from client delivery, not theory.