On this page
- 01Key takeaways
- 02What do UK social media demographics measure?
- 03How should a business read the age data?
- 04Why does aggregate reach mislead?
- 05Which demographic signals are worth acting on?
- 06When should you ignore the demographics entirely?
- 07What does this look like in practice?
- 08How do you check a demographic claim?
- 09Next step
- 10Sources and further reading
- 11Frequently asked questions
Key takeaways
UK social media demographics tell you which platforms can reach an age group, never which platform will reach your buyers. Use them to eliminate obviously wrong channels, then let your own customer research choose between whatever remains.
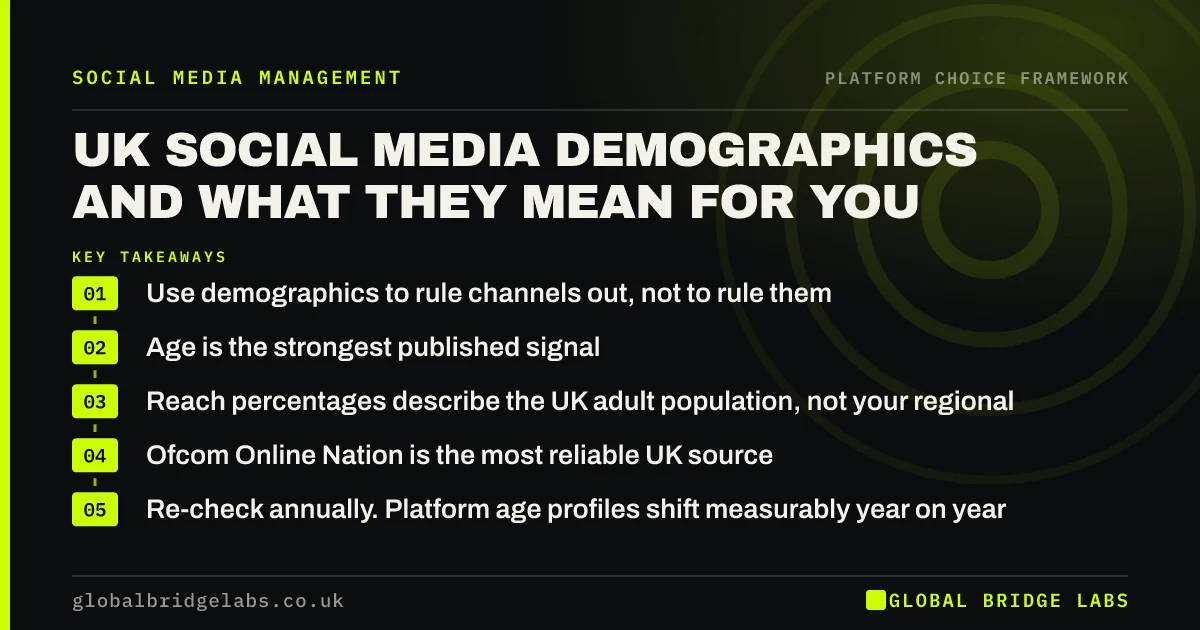
- Use demographics to rule channels out, not to rule them in.
- Age is the strongest published signal. Occupation and buying role you must gather yourself.
- Reach percentages describe the UK adult population, not your regional, sectoral segment.
- Ofcom Online Nation is the most reliable UK source. Platform figures run optimistic.
- Re-check annually. Platform age profiles shift measurably year on year.
Want the demographic picture translated into a channel decision? Message us on WhatsApp.
Chat on WhatsApp →What do UK social media demographics measure?
Reach and frequency across the UK adult population, usually by age and sometimes by gender and region. Ofcom's Online Nation report is the most methodologically sound UK source, because it uses panel measurement rather than platform self-reporting.
What it does not measure is occupation, seniority, buying authority or sector, which are the four variables that matter most to a business choosing a channel. That gap is why demographic data is a filter and not a decision.
How should a business read the age data?
As a rough skew rather than a boundary. Every large platform has users in every adult age band in the UK. The useful information is the centre of gravity and the direction of travel.
- Short-form video platforms skew youngest, with the steepest growth in the over-35 bands.
- Facebook's UK centre of gravity has aged steadily, well above its early user base.
- LinkedIn skews to working age with high seniority density, which no other platform matches.
- Pinterest skews female and behaves more like a search engine than a social feed.
- Messaging apps show the flattest age profile of all, which is why they work across segments.
Why does aggregate reach mislead?
Because your market is almost never the UK adult population. There are around 5.5 million private sector businesses in the UK, and the vast majority have no employees at all, so even a business-to-business audience is far smaller and more specific than headline figures suggest.
A platform reaching a large share of UK adults may still reach almost none of the 4,000 people in the country who could plausibly buy what you sell. Reach percentages answer a question about the country. Platform selection is a question about a few thousand people.
Which demographic signals are worth acting on?
Three, in this order of reliability. A platform where your buyer's age band is a small minority is a genuine warning. A platform where your buyer's working role is the reason people are there is a genuine positive. And a platform whose age profile is shifting toward your buyer is worth a trial, because you arrive before the competition does.
Everything else, including gender splits and time-on-platform figures, is interesting and rarely decisive. If a demographic statistic would not change what you do on Monday, it is not worth the time spent finding it.
We will tell you which demographic signals matter for your sector. Send us your buyer profile on WhatsApp.
Chat on WhatsApp →When should you ignore the demographics entirely?
When you have direct evidence from your own customers that contradicts them. Ten customers telling you where they check suppliers outranks any national chart, because the chart has no knowledge of your region, sector or price point.
Also ignore them when the platform's job is defensive rather than acquisitive. A profile that exists so prospects can confirm you are a real, trading business does not need to reach a demographic. It needs to be current, accurate and easy to find.
What does this look like in practice?
A UK independent pharmacy group came to us with a deck showing that a short-form video platform reached the largest share of UK adults under 35. The conclusion drawn was that the group should be producing video.
Their actual customers were predominantly over 55, arrived through GP referrals and local search, and checked opening hours on Google. The video plan would have consumed most of the available marketing hours to reach people who were not their patients. The demographic chart was correct and the decision it produced was wrong.
How do you check a demographic claim?
Ask three questions of any statistic before you plan around it. Who collected it, using what method, and in which year? Panel measurement by an independent body is reliable. Platform self-reporting is directional. A figure in a marketing blog with no source is not evidence.
Then ask whether it is about the UK specifically. A great deal of social media statistics circulating in the UK describe United States behaviour, where platform adoption differs meaningfully. Ofcom's Online Nation is the reference point worth returning to because it is UK-specific, methodologically transparent and published annually.
Next step
Use the published data for one job only: crossing off the channels where your buyers are clearly a rounding error. Then spend the rest of your research time on 10 customer conversations, which will tell you more about the remaining two or three than any report can.
Message us on WhatsApp and we will map your buyer segment to the platforms worth testing.
Chat on WhatsApp →Sources and further reading
- Online Nation: how the UK uses online services · Ofcom
- Business population estimates for the UK and regions 2025 · Department for Business and Trade
Frequently asked questions
What is the most used social media platform in the UK?
Headline usage varies by source and year, and it is the wrong question for a business. The platform most used by UK adults is rarely the one most used by your specific buyers, who are defined by occupation, region and buying role rather than by national averages.
Where can I find reliable UK social media statistics?
Ofcom's Online Nation report is the most reliable UK source because it uses panel measurement rather than platform self-reporting. Platform-published figures tend to run optimistic and define active users generously, so treat them as directional only.
Do social media demographics change quickly?
Age profiles shift measurably year on year, particularly on newer platforms where the initial young user base ages and older bands join. Re-check annually, and treat any demographic claim more than two years old as unreliable for planning.
Should B2B businesses use demographic data to choose platforms?
Only as a filter. Published demographics rarely capture occupation, seniority or buying authority, which are what B2B platform choice depends on. Use them to eliminate the channels where your buyers are clearly a rounding error, then research your own buyers directly by asking ten of them where they check suppliers.
Written by

Global Bridge Labs (GBL) is a UK–Sri Lanka partner for social media, websites and BPO. Everything here comes from client delivery, not theory.