On this page
- 01Key takeaways
- 02What is revenue per employee?
- 03How do you calculate revenue per employee?
- 04What is a good revenue per employee?
- 05How does outsourcing change the number?
- 06Why does the figure fall as firms grow?
- 07When is the ratio misleading?
- 08What does this look like in practice?
- 09Revenue per employee checklist
- 10Next step
- 11Sources and further reading
- 12Frequently asked questions
Key takeaways
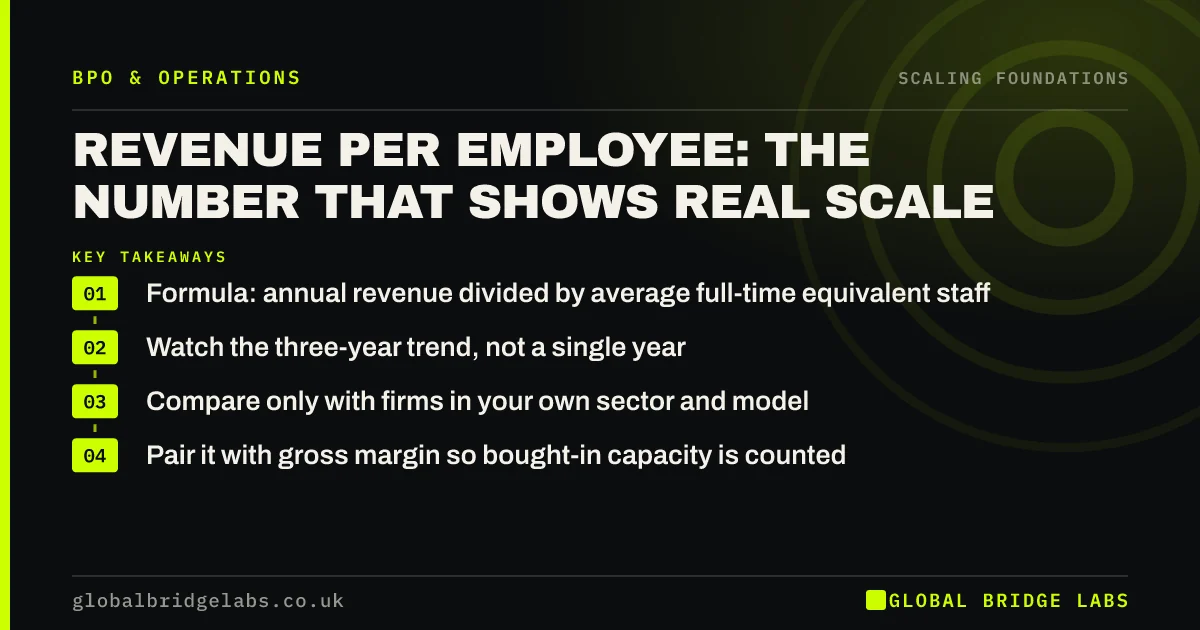
Revenue per employee for a small business is annual revenue divided by the average number of full-time equivalent staff. It is the simplest measure of whether a firm is scaling or just growing. The trend matters more than the figure: rising means each person supports more revenue, flat means you are adding people as fast as sales.
- Formula: annual revenue divided by average full-time equivalent staff.
- Watch the three-year trend, not a single year.
- Compare only with firms in your own sector and model.
- Pair it with gross margin so bought-in capacity is counted.
Want your revenue per employee trend checked? Message us on WhatsApp with three years of revenue and headcount.
Chat on WhatsApp →What is revenue per employee?
Revenue per employee is a productivity ratio that shows how much revenue a business generates for each person it employs. It is calculated by dividing total revenue for a period by the average number of full-time equivalent employees in that period. It is also called revenue per head.
How do you calculate revenue per employee?
Divide annual revenue by average full-time equivalent (FTE) staff. Count part-timers as fractions: two people on 20 hours a week are one FTE at a 40-hour week. Use the average across the year, not the year-end figure, or a hiring burst in the last quarter will distort the result.
- 1. Take revenue for the last 12 months.
- 2. Add up FTE staff at the end of each month.
- 3. Divide by 12 for the average.
- 4. Divide revenue by that average.
What is a good revenue per employee?
There is no single good figure, because it depends heavily on sector. A distributor reselling goods shows far higher revenue per head than a care provider or a consultancy. The useful comparisons are with your own past and with similar firms. A steadily rising figure with stable margin is the sign of a business that is scaling.
The Office for National Statistics publishes labour productivity by industry, which is a better guide to sector differences than any general benchmark.
How does outsourcing change the number?
Outsourcing raises revenue per employee, because the work is done without adding to the staff count. That is the point, but it also means the ratio can flatter a firm that has simply moved cost from payroll to suppliers. Always read it with gross margin or profit per employee, which take the cost of bought-in capacity into account.
- Revenue per employee: shows leverage on your own team.
- Gross margin: shows whether bought-in capacity is efficient.
- Payroll as a percentage of revenue: shows fixed staffing weight.
Want all three ratios worked out for your business? Send us the figures on WhatsApp.
Chat on WhatsApp →Why does the figure fall as firms grow?
Revenue per employee often falls as a firm grows because support roles are added faster than revenue. Each new team needs coordination, each manager needs reports, and admin that was absorbed informally becomes a job. The fall is a warning that the business is buying size with headcount.
When is the ratio misleading?
The ratio misleads when revenue includes large pass-through costs, when contractors do much of the work, or when a firm is investing ahead of sales. A business that has just hired for a contract starting next quarter will look worse for a while. Use it as a prompt for questions, not a target to hit.
What does this look like in practice?
A pattern we see in UK firms of 15 to 30 people: revenue per head rose every year until the business passed about 12 staff, then slid as administrators, coordinators and a second manager arrived. Nobody decided to become less efficient. Plotting the ratio by year usually pinpoints when support hiring overtook sales.
Revenue per employee checklist
Run these numbers once a year, before the staffing plan is agreed.
- Calculate average FTE for each of the last three years.
- Calculate revenue per employee for each year.
- Plot it beside gross margin.
- Split staff into revenue-earning and support roles.
- Check which planned hires would lower the ratio.
- Ask whether that work could be bought as flexible capacity.
Next step
Send us three years of revenue and headcount. We will calculate the trend and show where support work could be scaled without adding to the staff count.
Message us on WhatsApp for a revenue per employee review, or book a 30-minute consultation.
Chat on WhatsApp →Sources and further reading
- Labour productivity · Office for National Statistics
- Business population estimates for the UK and regions 2025 · Department for Business and Trade
Frequently asked questions
What is the formula for revenue per employee?
Revenue per employee equals total revenue for a period divided by the average number of full-time equivalent employees in the same period. For annual figures, add the monthly FTE counts, divide by 12, then divide the year's revenue by that average. Count part-time staff as fractions of a full-time role.
Should contractors be counted in revenue per employee?
For the standard ratio, no: it counts employees. For a truer picture, calculate a second version that includes regular contractors and outsourced seats as FTE. The gap between the two shows how much of your capacity is flexible, and stops outsourcing from making the headline figure look better than it is.
Why is revenue per employee important?
It shows whether a business is becoming more or less productive as it grows. A rising figure means revenue is growing faster than headcount, which usually signals scale. A falling figure means the firm is adding people faster than sales, often in support roles, and margin is likely to follow.
How can a small business increase revenue per employee?
Increase it by raising revenue without matching hires: improve pricing, remove routine work from fee earners, automate rules-based tasks and move variable volume to managed outside teams. Check margin at the same time, because revenue per employee can rise while profit falls if bought-in capacity is poorly managed.
Written by

Global Bridge Labs (GBL) is a UK–Sri Lanka partner for social media, websites and BPO. Everything here comes from client delivery, not theory.